Anomaly Detection
The anomaly feature helps detect unusual events by examining event data after a learning period established a baseline of known data.
- A user logs on via RDP from a new remote IP address
- A user starts a new process
- A logon by user that has never logged on before via the same logon type (e.g. console vs RDP)
Permission Inventory
Permission inventory enumerates the permissions of select folders and makes the permission data (ACL, ACE) available in the web reports.
Added in EventSentry v5.0
Fully 64-Bit & Latest PostgreSQL Database
Even though most components in EventSentry were already 64-bit, version 5 migrates all components to 64-bit while still supporting monitoring of 32-bit hosts.
The built-in PostgreSQL database has also been upgraded to 64-bit as well as the most recent version available from PostgreSQL, v14.2.
Web Reports : Core Update
We revamped the menu in the web reports to make it easier for both new and existing users to access all features in the web reports. The Web Reports also received a number of improvements under-the-hood:
- Faster database connection pool
- Updated backend libraries with enhanced security and higher throughput
- Improved overall memory usage
- Reduced page response time
Integrations
The web reports authentication can now be integrated with any RADIUS servers, giving enterprise users the option to authenticate with either a LDAP or RADIUS server.
The management console can now integrate with Microsoft LAPS which can be utilized in the remote update functionality when managing remote Windows hosts.
Expanded Inventory
We are making service (aka daemon) monitoring available to Non-Windows devices that support SSH logins.
You'll be able to view an inventory of all of your AD users, groups and computers in EventSentry.
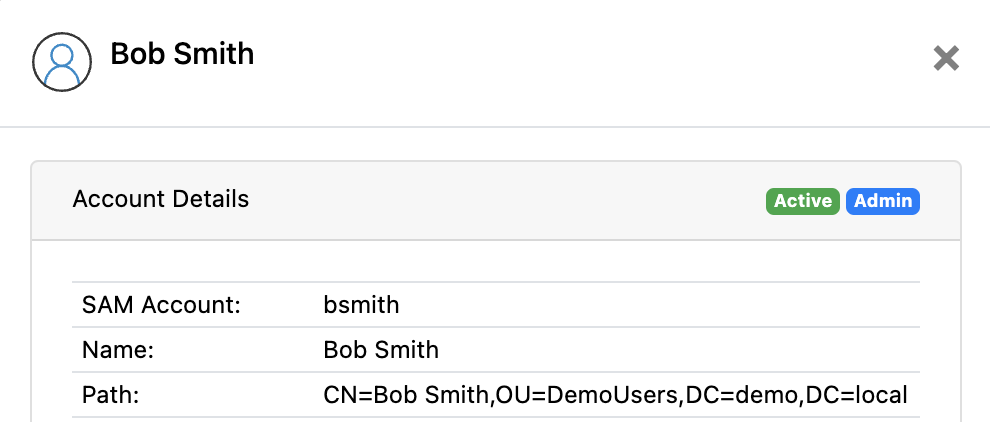
The user inventory page has also been enhanced with a convenient user details dialog.
Added in EventSentry v4.2
Validation Scripts
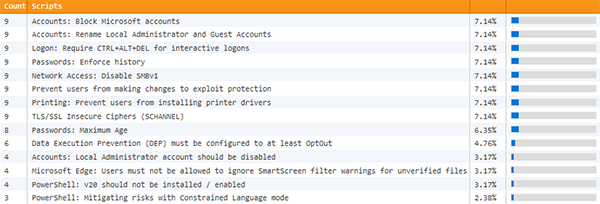
Now with the 150+ EventSentry Validation Scripts, available in v4.2. Our managed security & health validation scripts continuously compare critical settings on your monitored hosts with our baseline, immediately indicating potential risks.
EventSentray
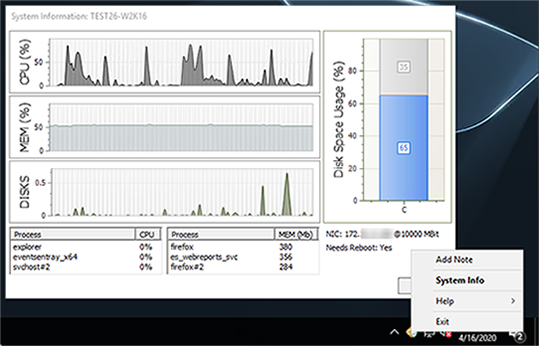
With the tray app "EventSentray", your end users can submit support tickets to many common ticketing systems via email or HTTP requests right from the tray with a customizable link. And the best part? Support tickets created by the app not only include pertinent system information (current CPU %, host name, uptime, ...) but can also include a current screenshot.
Browser Extensions
While web browser extensions can boost productivity and make your end users excited, they also have inherent privacy and security risks. All major web browsers let users install as many extensions as they wish by default - without restrictions!
But do you actually know how many Firefox, Chrome or Edge extensions are installed on browsers across your IT infrastructure?
Import / Export Dashboard Templates
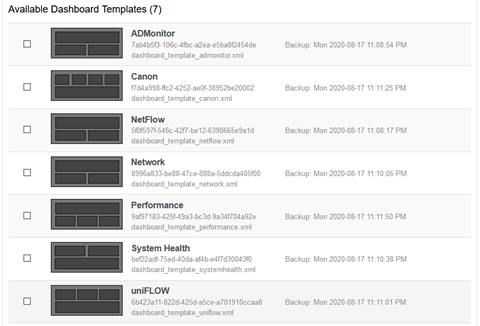
To make setting up dashboards easier and faster, EventSentry now ships with a number of dashboard templates that you can import. You can also export your own dashboards and import them on another EventSentry installation.
Added in EventSentry v4.1
Windows Password Reminders
Since ADMonitor knows when a user's password expires, it can send out daily password expiration emails directly to the end user when the password is close to expiring. The only requirement is that there is a predictable way to dynamically build the email address of the end user using one of the user attributes available in the web reports.
Pending Reboots
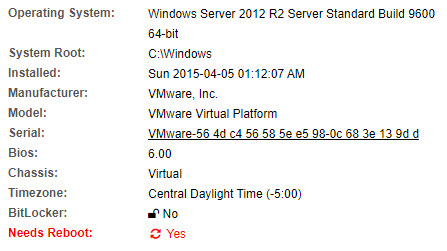
Do you know how many servers and workstations on your network require a reboot to finish installing Windows updates or software? EventSentry now detects pending reboots as part of its inventory functionality – simply schedule a report on this new flag and you’ll never forget to reboot critical systems again.
Custom Performance Metrics
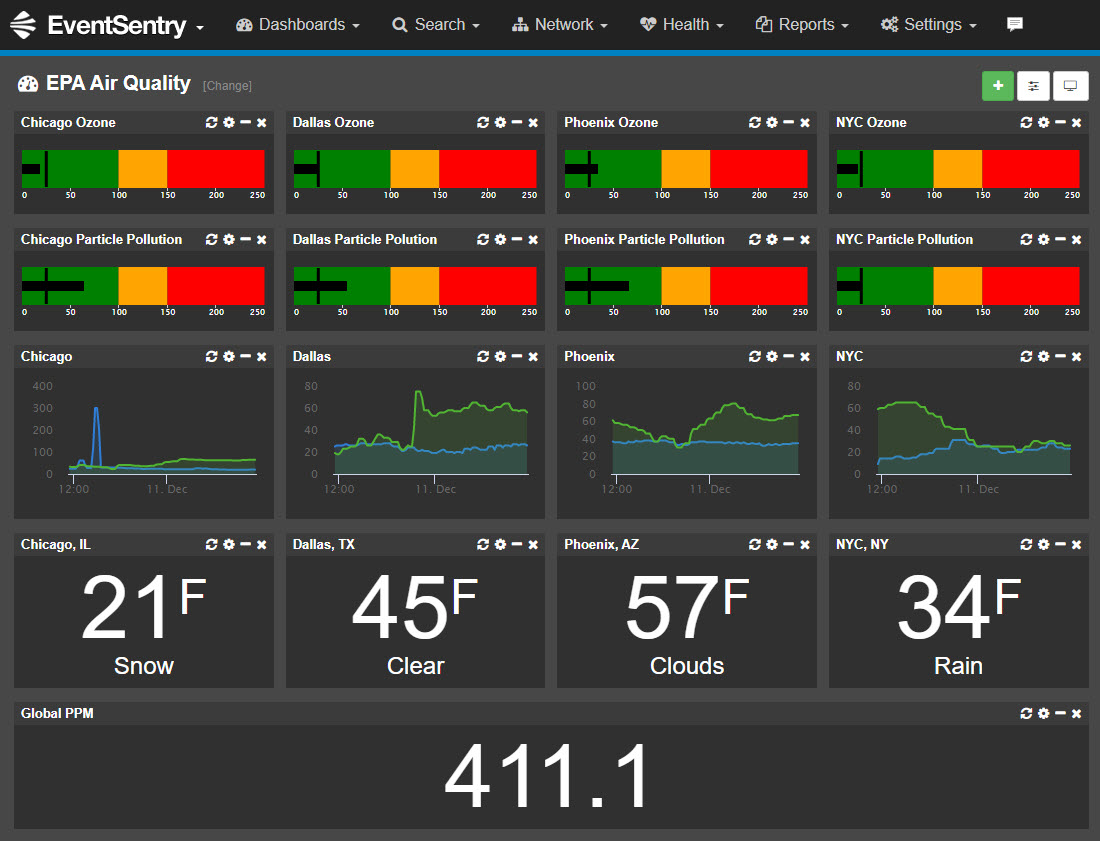
Numerical data from system tools, web pages and log files can now be visualized and alerted upon – all with the same familiar interface. An example of this new functionality can be seen on our live demo, where we’re displaying air pollution stats from 4 major cities in the US along with the global PPM (courtesy of the EPA).
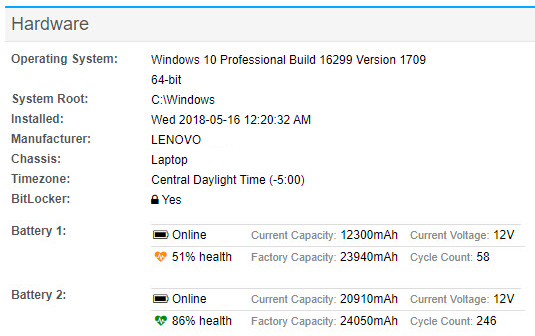
Monitor Battery Health
With an increasing number of employees working remotely, ensuring that laptops are properly monitored and secure should remain a priority for any company that manages laptops. Starting with v4.1, EventSentry detects the BitLocker status of any host, allowing you to run reports to identify all laptops that pose a security risk due to their hard drive not being encrypted.
Added in EventSentry v4.0
Native Active Directory Monitoring
ADMonitor, our new add-on component, allows you to:
- Show object changes down to the attribute level
- Identify idle accounts, disabled accounts, stagnant passwords
- Search a detailed log of Group Policy changes
- Lookup before and after values when a change occurs
Redesigned Management Console
With a fresh look and the new ribbon, configuring EventSentry has never been easier! Many common tasks have been simplified so that working with EventSentry is now more intuitive and faster. The new built-in event log viewer makes viewing event logs, including the new Application & Services logs of Windows, much easier than the built-in Windows event viewer.
Threat Intelligence
EventSentry NetFlow capabilities now include additional levels of detection:
- Alert on malicious IPs
- Detect port scans
- View recent threats on dashboards
Added in EventSentry v3.5
Windows Registry Tracking
Easily normalize Windows registry changes:
- Monitor changes made by a specific program
- Identify registry changes by user
- Search a detailed log of registry actions
- Lookup before and after values when a change occurs
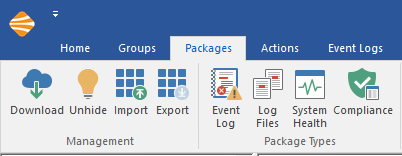
Tag-based Packages
- Easily assign configuration packages based on your specified tags
- Search your environment for resources associated with a certain role or location
Expanded Process Monitoring
- Quickly identify which process is listening on a TCP port
- Track and correlate network activity from Sysmon
- Lookup SHA checksums for running processes
Added in EventSentry v3.4
Lateral Detection
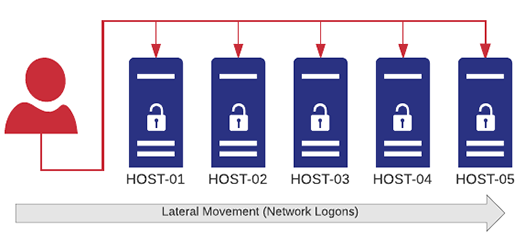
Server-side real-time thresholds significantly increase the security of your network by detecting lateral movement and similar activity in a network:
- Same user logging on to multiple hosts within a specific time frame
- A process quickly spreading (trickling) across multiple hosts
- A user running too many processes – either on a single or multiple hosts
- Authentication failures of a user on too many hosts
- Too many unique logon types used by a user account
Enhanced Ransomware detection
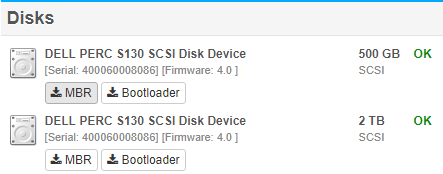
- MBR/BootSector Monitoring & Backup for easy recovery
- File Entropy describes the randomness of a file, essentially a metric that can help detect compressed and encrypted files.
UPS & Battery Monitoring
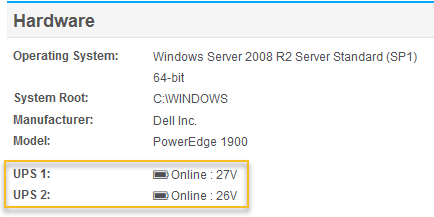
Any UPS directly attached to a server/workstations that is detected by Windows can now be monitored by EventSentry. The status of the UPS will show up on the host inventory page, and alerts will be generated when a host is on battery power and back on AC power. EventSentry can also initiate a shutdown when the remaining run-time or charge level falls below a certain limit.
Software Version Checker
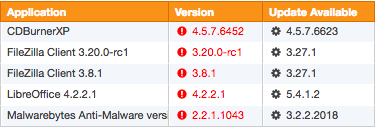
In v3.4 we are taking this to the next level by providing the latest version available from the publisher for a growing list of 100+ software packages so that you can effortlessly identify outdated software on your network.
User Activity
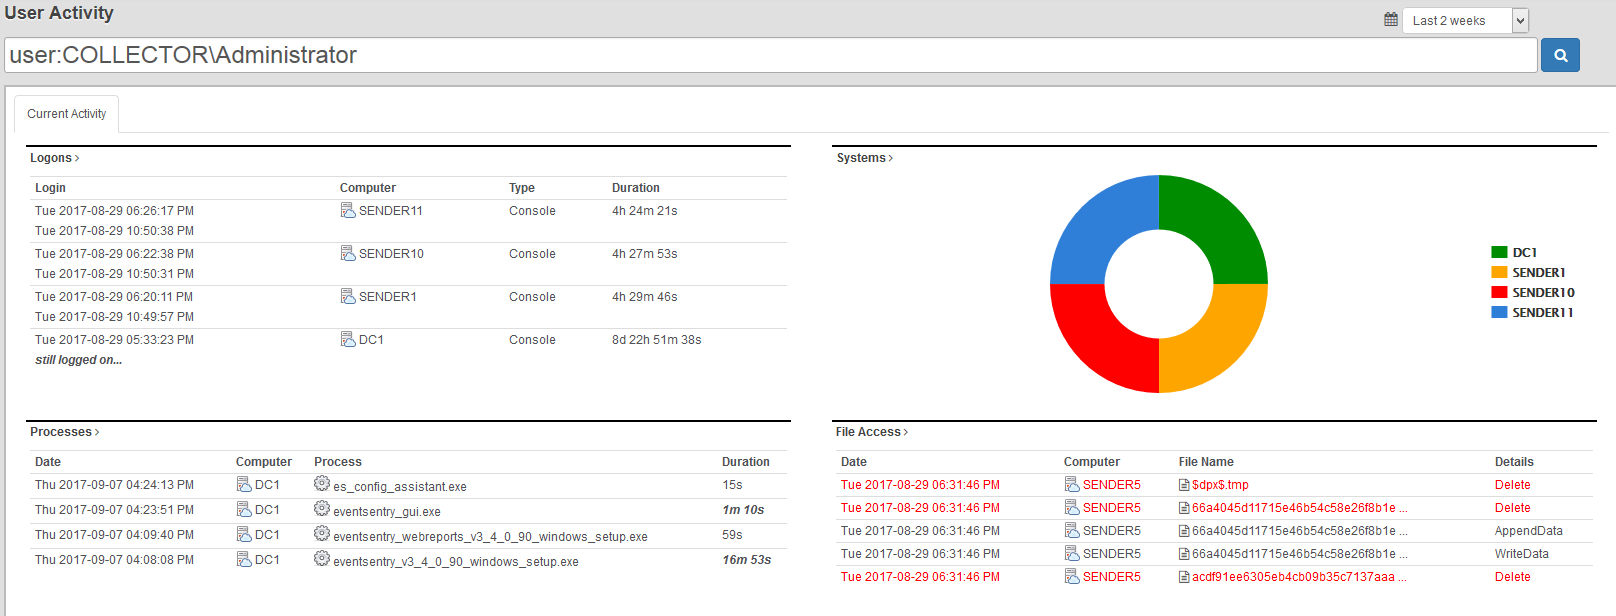
The user activity page makes seeing all activity by a user as easy as never before!
- Logons
- Processes
- File Access
- Active Directory Changes
- Tasks
- Events
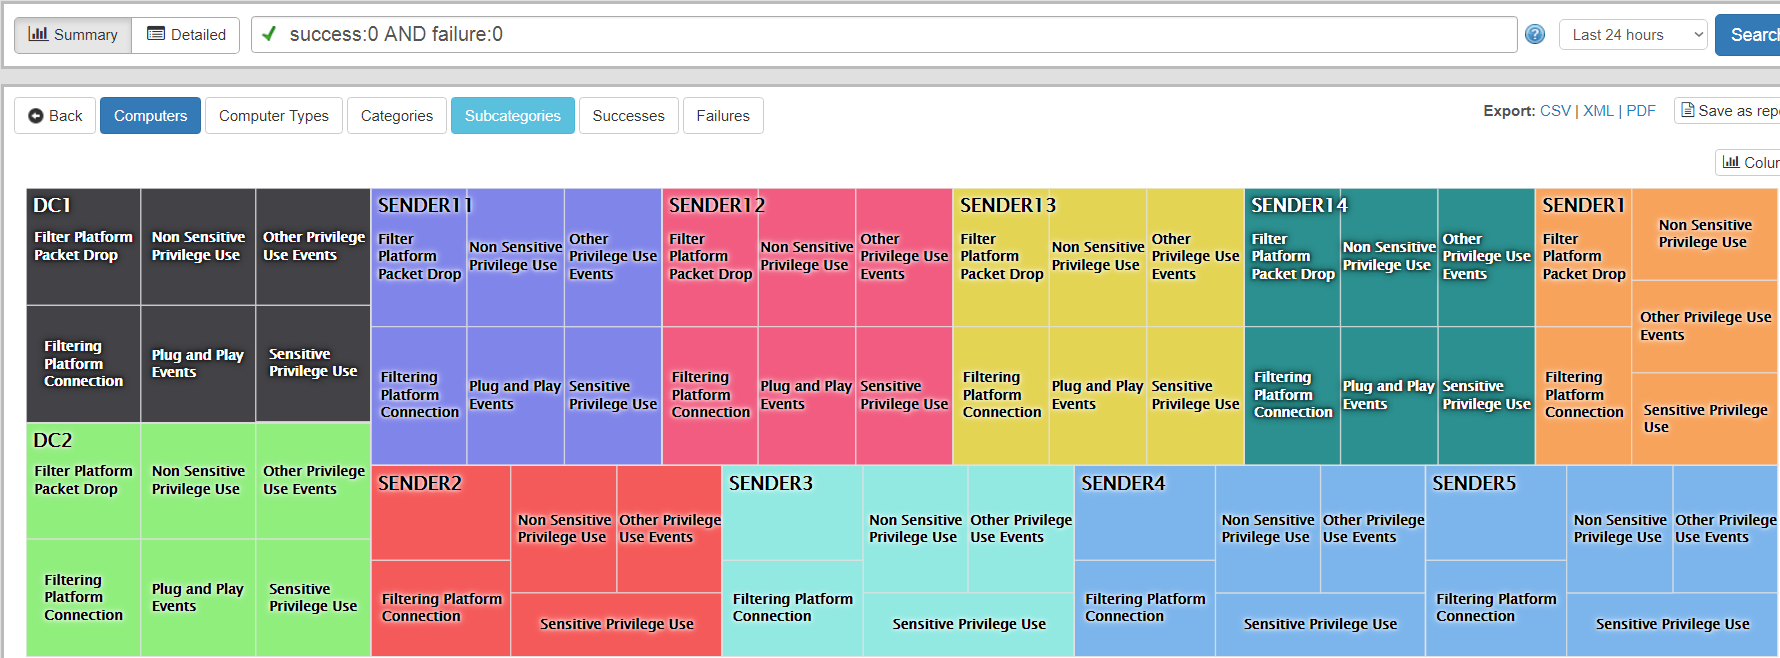
Audit Policy Status
Reviewing the current audit status of all monitored hosts can be important however, if only to verify that group policies are configured correctly.
- Compare/review audit settings of a particular sub category (e.g. “Registry”) among all monitored hosts
- View all disabled audit settings across all or select hosts
- (Re)view audit settings based on computer types (e.g. domain controllers, servers, workstations)
Expanded Syslog Formats
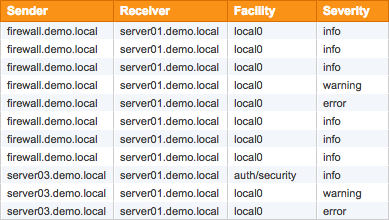
Starting with version 3.4, EventSentry now supports the following formats in the Syslog action:
- RFC 3164 (legacy)
- Snare
- RFC 5424
- GELF (Graylog)
- Common Event Format (CEF)
- JSON (customizable)
Added in EventSentry v3.3
NetFlow
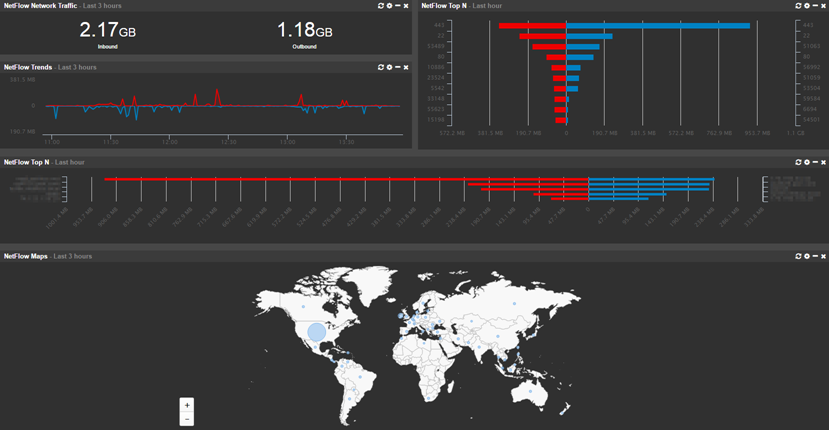
Collecting NetFlow data allows you to see all traffic metadata which passes through network devices that support NetFlow, including:
- Visualize all network traffic in a variety of ways and reports
- Analyze network data for forensic investigation
- Utilize network traffic data for troubleshooting purposes
- Map network traffic to geo location
- Correlate network traffic with Active Directory users (requires workstation monitoring)
- Measure bandwidth utilization
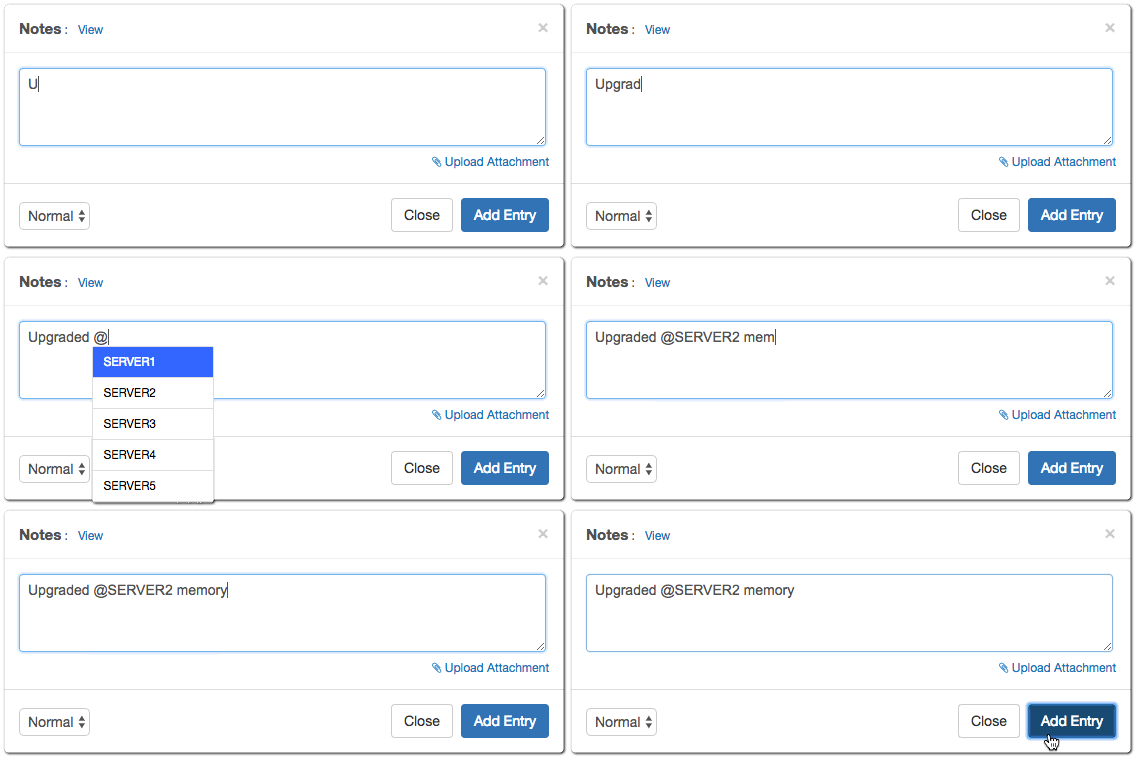
Notes / Documentation
Communicating and documenting your network has just become a lot easier – add notes and/or upload documents in the web reports. Simply @ mention the computer name and the web reports will associate the update with the respective device on the network.
Enhanced Event Messages with GeoIP
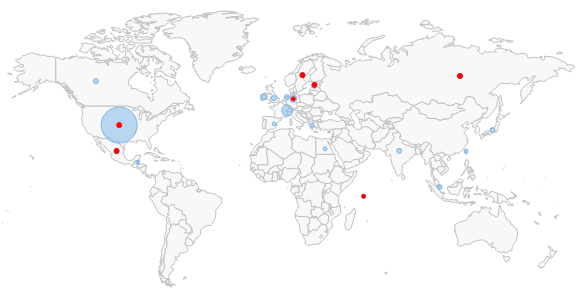
EventSentry can automatically extract IP addresses from any event and supplement the IP addresses with reverse lookup and/or Geo IP lookup data. Providing geolocation and/or host names inside the email makes the usability of email alerts for the recipient significantly more useful without requiring the recipient to perform manual lookups.
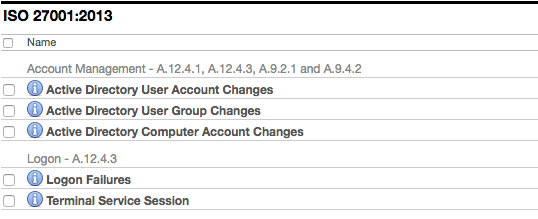
Expanded Compliance Reports
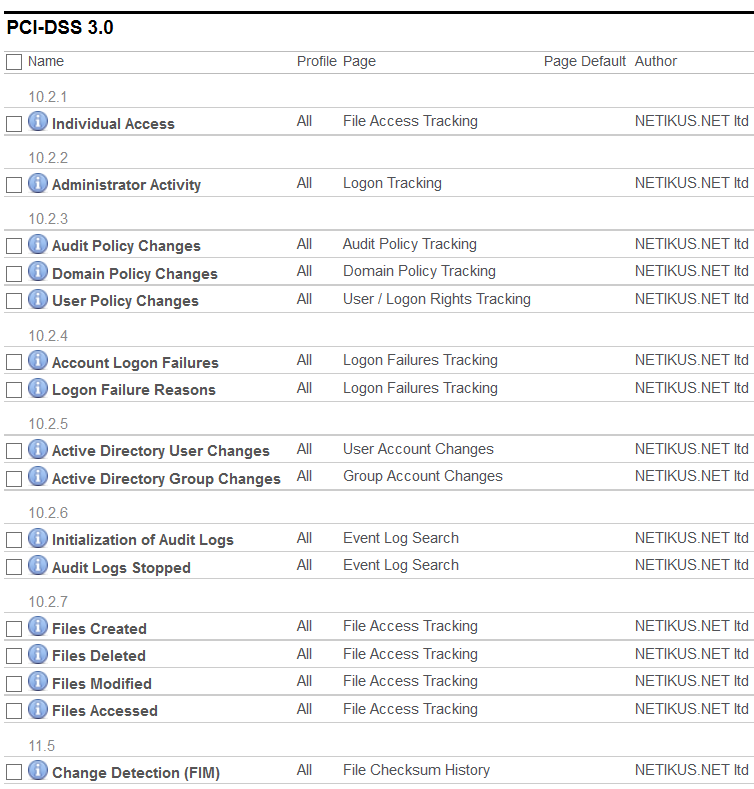
Our compliance module has been updated with new requirements. It is now possible to automate reports to be sent via email or saved directly to a folder.
- PCI-DSS
- FISMA
- HIPAA
- GLBA
- Sarbanes Oxley
- ISO 27001:2013 NEW
Added in EventSentry v3.2
Central Collector Service
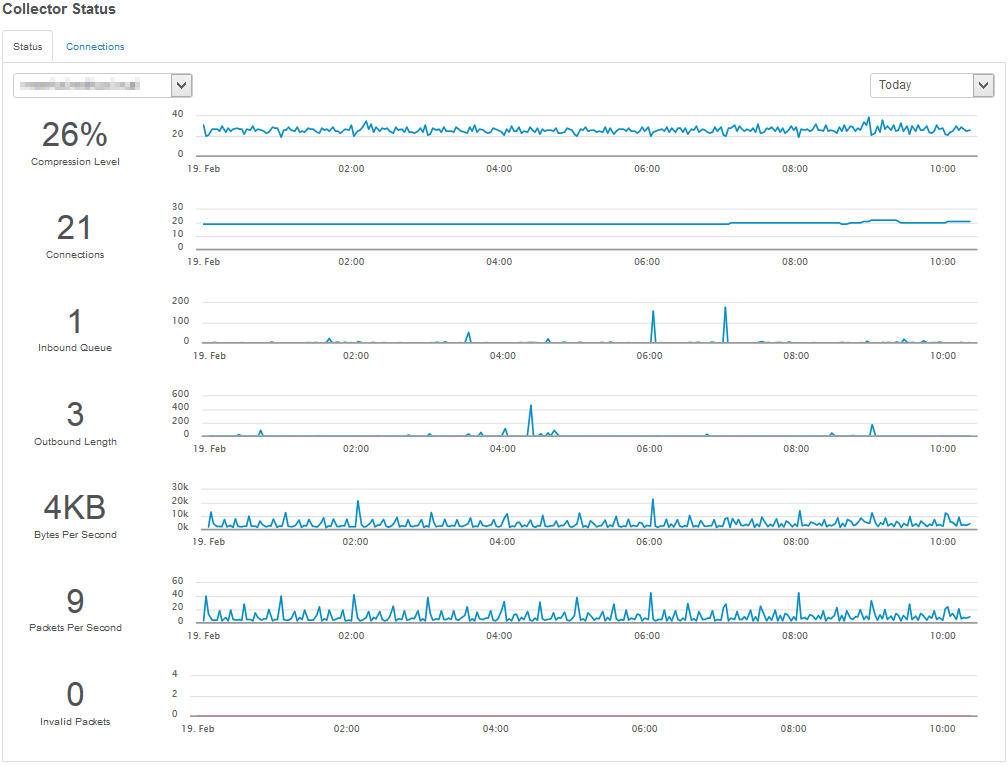
A central collector service supports data collection over insecure mediums (e.g. Internet) through strong TLS encryption. Also supports local caching and compression.
- Database
- Email (SMTP)
- Syslog
- Text File

Switch Inventory
Finding the port on a switch to which a server, workstation or network device is connected is often a time-consuming and annoying process for most SysAdmins. Starting with version 3.2, EventSentry tries to ease that pain by showing exactly to which switch – and port – a host is connected to. All you need to do is add the switch to the EventSentry configuration.
Compliance Requirements
The new compliance module will install a number of reports that pertain to the specific compliance requirement that was enabled. Every report will be associated with a specific control (e.g. PCI 10.2.2) and allow you to setup a required review, job and more.
- PCI-DSS
- FISMA
- HIPAA
- GLBA
- Sarbanes Oxley
Enhanced Language Support
Finally, the web reports are now also officially available in 6 additional languages: French, Spanish, Polish, Portuguese, Dutch and Italian. This brings the total number of supported languages in the web reports to 9!
Added in EventSentry v3.1
Multiple Dashboards
Completely overhauled Network Dashboard now offers support for multiple custom dashboards. Share your dashboard and iterate automatically. Also, a new TV mode was added for enhanced viewing on TVs around the office.

Expanded Tile Options
Display the current status of performance, disk space or environment sensor value. We've added heatmaps, gauges, bullet graphs and meters.
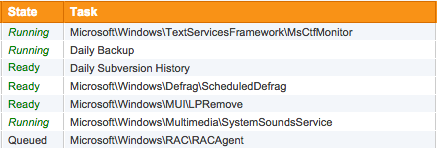
Scheduled Task Inventory
Monitor the scheduled tasks running your network. With change detection you can receive alerts and keep a search history for each task.
Virtual Host Inventory
Quickly see which hosts are running under which servers. Supports Hyper-V and ESX.
- Virtual Machine Name
- Current Status
- Operating System (when available)
- CPU Count
Added in EventSentry v3.0
Powerful Search Queries
The completely redesigned web reports provide several new reporting capabilities with more granular searching syntax to help you find that needle in the haystack.
group:Servers and type:(error or warning)


Scheduled Reporting
Any report can now automatically sent via email. Using this functionality you can generate a detailed report on specific error messages across your network or performance trends on your critical servers.
Network Status
Spot problems with a glance with our improved overview pages. With the new customizable dashboards, you can leave page up and ensure you are always looking at a the most recent information.


Cross Platform
We now offer the web reports as a stand-alone installer so you can host your reports any where you would like.
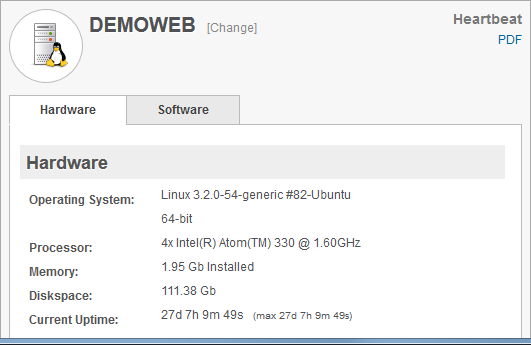
Network Inventory
No more running to server room to look up a service tag number. EventSentry provides a detailed inventory of all your monitored hosts. Quickly see your warranty information, check available memory slots, or identify disk serial numbers.
Network Monitoring
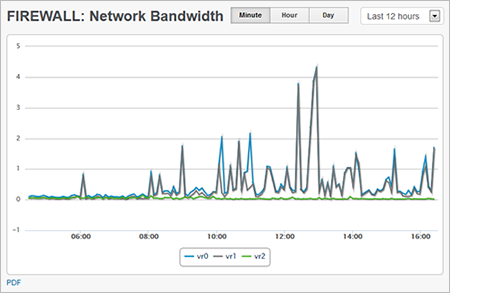
It is now possible to poll SNMP counters to check the output load on a UPS or view the network bandwidth trends on your routers and switches.
You can now monitor performance metrics (CPU, avaliable memory, etc) on your Linux machines.
ARP Daemon
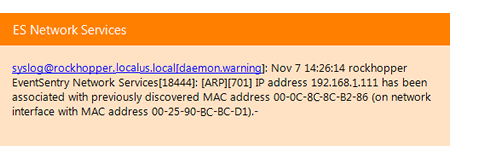
The new Arp Watch daemon tracks all network activity on the data link layer to alert you when new devices are added to your network. Network activity is also continuously tracked so that you can see which MAC addresses are actively being used on your network, including MAC to IP address mappings, and when they were last seen. The Arp Watch Daemon also detects ARP Spoof attempts in real-time.
