Navigation: Monitoring with EventSentry > System Health Monitoring >
Process Monitoring


|
Navigation: Monitoring with EventSentry > System Health Monitoring > Process Monitoring |
|
|
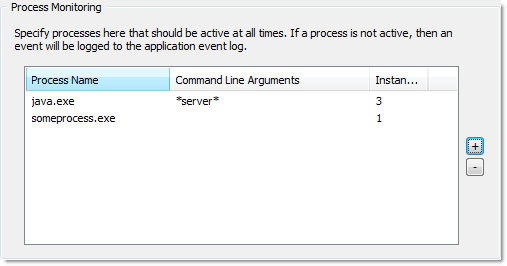
With process monitoring you can be notified if one or more required processes are inactive, and also detect potential memory leaks in applications (deprecated). Process monitoring can evaluate the command line parameters of a process, and the minimum number of required instances of a process may be specified as well.
Process Monitoring
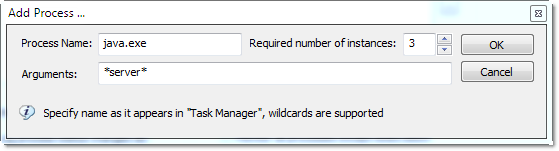
Monitoring a process To monitor a process, click the + button and specify the process name as well as the number of required instances (usually "1"). Wildcards can be specified for the process name, e.g. "java*" would match all processes starting with "java".
Command Line Parameters If only processes with specific command-line parameters should be evaluated, then the required command line can be specified as well. If a command line is not specified, then it will be ignored. This parameter supports wildcards as well.
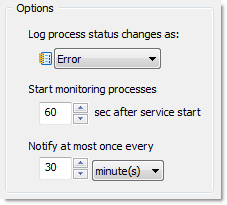
Options You can customize the severity with which an event is written to the event log by changing the "log errors as" option below the list. When a specified process is not active, event 10401 is logged to the event log once. When the process becomes active again event 10402 will be logged to the application event log (see also Event Log).
You can also configure a startup delay to avoid false notifications for processes that start after the EventSentry service is starting. Simply set the "Start monitoring processes" option to the number of seconds it takes for all processes to be active.
"Notify at most once every" sets how often an alert is generated when the required process(es) is not active.
Process Memory Monitoring
EventSentry can find most processes that leak memory. The memory consumption of all or selected processes is monitored over a period of time, and algorithms try to determine whether a process might be leaking memory.
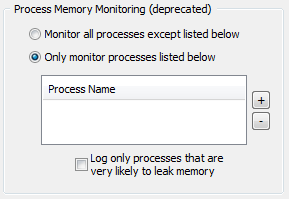
Monitoring All Processes This is the recommended configuration, EventSentry will monitor all processes in the system and analyze their memory patterns. If a process seems to be leaking memory then a record will be written to the Application event log. Select "Monitor all processes except those listed below".
You may exclude certain processes from being monitored, which is useful when they were incorrectly determined to leak memory. Click the + button and specify the process name (without path).
Monitoring Only Selected Processes You can choose to only monitor selected processes, for example when you think that a certain process is leaking memory. Select "Only monitor processes listed below" and add the process(es) to the list by clicking the + button.
Log Only Processes that are very likely to Leak Memory Process Memory Monitoring can either determine that a process is somewhat likely to leak memory, or that a process is very likely to leak memory. By activating this check box you instruct EventSentry to ignore processes that are somewhat likely and only log processes that are very likely to leak memory.
Monitoring Intervals If process memory monitoring is not working as accurately as expected then you may contact our support team to tweak the monitoring intervals which can yield more accurate results. Please do not modify these values without contacting our support team.
Permanently Excluded Processes The following processes are permanently excluded from memory monitoring:
|