I am e-x-c-i-t-e-d to announce the availability of EventSentry v3.2 and tell you more about the new features and improvements. So, if you’re looking for a little bit more than the release notes then read on!
Collector
The biggest new feature in 3.2 is the collector, a new central component which enables a 3-tier architecture in EventSentry. Traditionally, the EventSentry agents have been communicating directly with email servers, databases and other services. While this usually worked well – and is still desirable in many setups – it does impose a limitation in some scenarios:
- The SMTP server cannot be configured to allow relaying and/or accepting SMTP connections from remote clients
- The central database cannot be configured to allow connections from remote clients
- Agents need to communicate over an insecure medium like the Internet
- Installing ODBC drivers is not an option
- Remote agents communicate over unreliable network connections (e.g. satellite, laptops, …)
The collector addresses the above limitations by acting similar to a proxy between the remote agents and the service (e.g. database). In a nutshell, it provides the following benefits:
- Agents only communicate with the collector over a single port
- All traffic can be encrypted and compressed
- Database connection details do not need to be stored on the agents anymore
- All collected data is cached on the agents if and while the collector is unreachable
Whether you will need the collector or not will largely depend on your network setup. If all of your hosts are in the same data center and/or the same LAN, the collector may provide little benefit. If you are a MSP and monitoring remote sites and laptops however, then the collector is probably what you have been waiting for!
When upgrading (or installing from scratch), the post-installer configuration assistant will ask you whether you are interested in enabling the collector.

If you are installing from scratch, then enabling the collector during the installation is all you need to do. When upgrading, an additional step is required – an action needs to be configured to use the collector. While the collector service is installed & started during the upgrade when selected, it will not enable any of the existing actions to use the collector. As such, if you want to route data for a specific action through the collector, that needs to be configured. Simply edit the action and click the “Use Collector” check box on the bottom left and push the configuration.
In version 3.2.1, the following actions can be routed through the collector:
- Database
- Email (SMTP)
- Syslog
- Text File
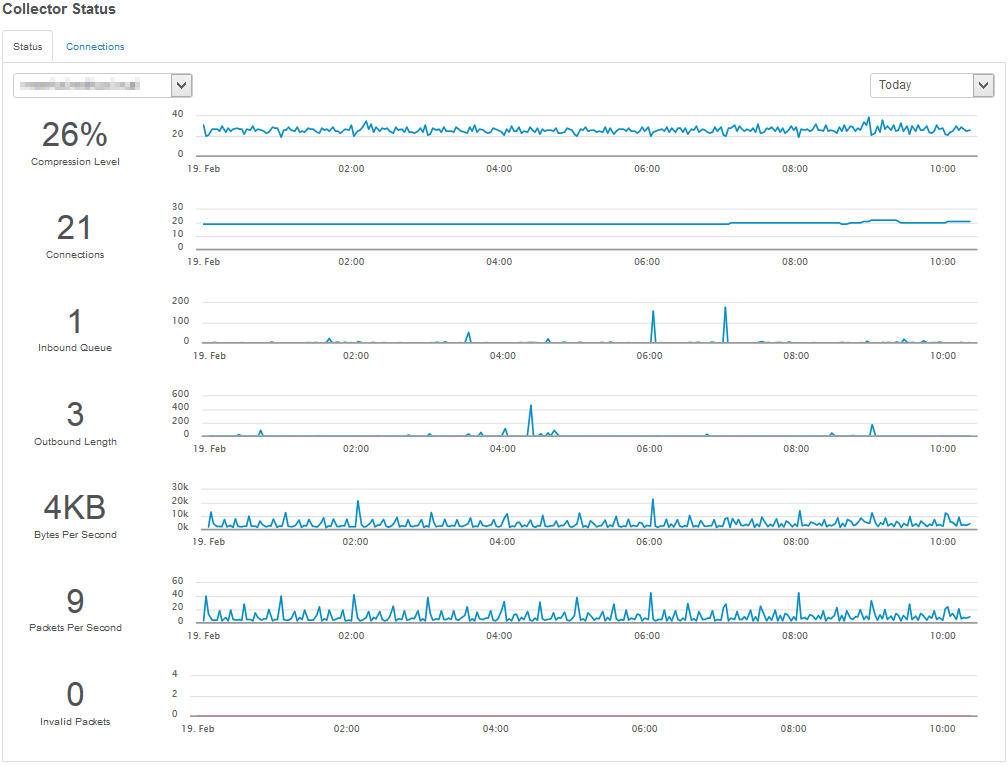
Since the collector, when enabled, is a critical component, we recommend monitoring the collector stats either through the collector status page (Maintenance -> Collector Status) or by adding the collector status tile to one of your dashboards.
There is one other advantage the collector can bring when routing emails through it:
- Emails from multiple hosts can be grouped together (if the action polling interval is sufficiently high)
- Action thresholds can now be applied centrally
Both features can help reduce the number of emails you receive from EventSentry, usually a popular thing to do!
Compliance Modules
EventSentry has always included the compliance tracking components which monitor and interpret Windows security events. Compliance tracking provides process, console, account management and other tracking reports. While popular and extremely useful, the compliance reports themselves don’t tell the user which particular compliance requirement they address.
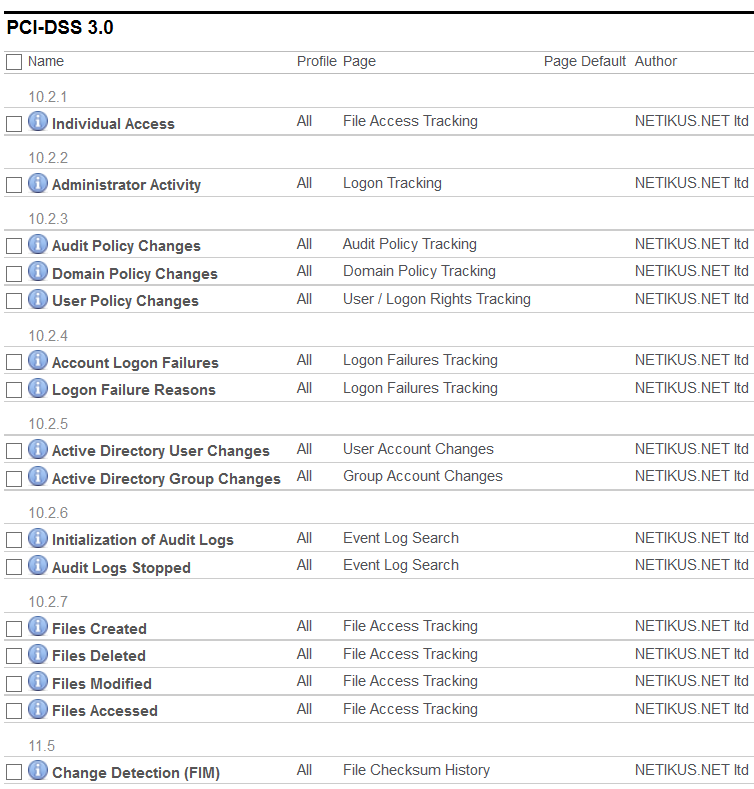
Say Hello to the new compliance modules, which provide detailed, out-of-the-box reports for:
- PCI-DSS
- FISMA
- HIPAA
- GLBA
- Sarbanes Oxley
Once a compliance module is enabled, it will install a number of reports that pertain to the specific compliance requirement that was enabled. Every report will be associated with a specific control (e.g. PCI 10.2.2) and allow you to setup a required review, job and more.

(Network) Switch Mapping
Finding the port on a switch to which a server, workstation or network device is connected is often a time-consuming and annoying process for most SysAdmins. Starting with version 3.2, EventSentry tries to ease that pain by showing exactly to which switch – and port – a host is connected to. All you need to do is add the switch to the EventSentry configuration, make sure that it can be monitored via SNMP and that it provides the MAC to port mappings via SNMP (OID 1.3.6.1.2.1.17.4.3.1.2 – iso.identified-organization.dod.internet.mgmt.mib-2.bridge.dot1dTp.dot1dTpFdbTable.dot1dTpFdbEntry.dot1dTpFdbPort). This feature should work well with all mainstream managed switched, and we haven’t run into a switch yet where this feature wasn’t provided or did not work.

Once EventSentry pulls the MAC to Port mappings, you will be able to retrieve the collected information in two ways:
- Through the Inventory – Switch page, which will show all monitored switches and connected devices
- Through the Inventory – Host page. If the switch port can be detected, it will be displayed next to the IP address of the network card
Since switches only provide MAC addresses, EventSentry attempts to map MAC addresses to host names and IP addresses by analyzing the hardware inventory details as well as the ARP status table when available. As such, it is recommended to enable the ARP component of the network services if the results on your switch inventory page are incomplete.

Web Reports Improvements
Starting with a visual overhaul of the interface, the web reports also received an internal overhaul to improve overall performance, especially when using multiple profiles. The performance trends page can now display multiple charts on a single page, and the host inventory page now shows the highest supported USB version on that host.
Managing multiple reports is easier now through the ability to bulk-edit reporting settings. Reports can now also be saved to a folder instead of being emailed.
Finally, the web reports are now also officially available in 6 additional languages: French, Spanish, Polish, Portuguese, Dutch and Italian. This brings the total number of supported languages in the web reports to 9!
Management Console Improvements
Improvements in the management console pertain mostly to remote update and computer management. Hosts can now be imported from a network scan, which is particularly useful when managing network devices which often don’t show up in Active Directory. The network scan is multi-threaded and can scan a class C subnet in a few seconds and even supports checking TCP ports for hosts which have ICMP disabled.
Remote update can now store the result of every activity in CSV file(s), and output from remote update can be toggled with the context menu to apply remote update actions to a sub-set of hosts easily.
Also new is the ability to export all event log filters to a CSV file allowing you to analyze the results in your favorite spreadsheet application to identify issues, duplicates etc.
That’s all folks. Time to get cracking on 3.3!