Creating your very own event message DLL

If you’ve ever wrote code to log to the Windows event log before (e.g. through Perl, Python, …), then you might have run into a similar problem that I described in an earlier post: Either the events don’t look correctly in the event log, you are restricted to a small range of event ids (as is the case with eventcreate.exe) or you cannot utilize insertion strings.

In this blog post I’ll be showing you how to build a custom event message DLL, and we’ll go about from the beginning to the end. We’ll start with creating the DLL using Visual Studio (Express) and finish up with some example scripts, including Perl of course, to utilize the DLL and log elegantly to the event log.

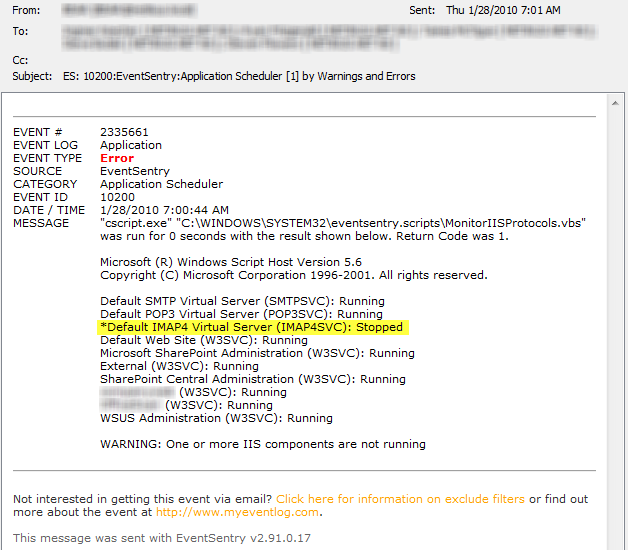
Let’s say you are running custom scripts on a regular basis in your network – maybe with Perl, Python, Ruby etc. Your tasks, binary as they are, usually do one of two things: They run successfully, or they fail. To make troubleshooting easier, you want to log any results to the event log – in a clean manner. Maybe you even have sysadmins in other countries and want to give them the ability to translate standard error messages. Logging to the event log has a number of benefits: It gives you a centralized record of your tasks, allows for translation, and gives you the ability to respond to errors immediately (well, I’m of course assuming you are using an event log monitoring solution such as EventSentry). Sounds interesting? Read on!

Yes, you can do all this, and impress your peers, by creating your own event message file. And what’s even better, is that you can do so using all free tools. Once you have your very own event message file, you can utilize it from any application that logs to the event log, be it a PowerShell/perl/python/… script or a C/C++/C#/… application.

To create an event message file, you need two applications:

The reason you need the platform SDK, is because Visual Studio Express does not ship with the Message Compiler, mc.exe, for some reason. The message file compiler is essential, as without it there will be no event message file unfortunately. When installing the platform SDK, you can deselect all options except for “Developer Tools -> Windows Development Tools -> Win32 Development Tools” if you want to conserve space. This is the only essential component of the SDK that’s needed.

An event message file is essentially a specific type of resource that can be embedded in either a DLL file or executable. In EventSentry, we originally embedded the message file resources in a separate DLL, but eventually moved it into the executable, mostly for cleaner and easier deployment. We’ll probably go back to a separate message DLL again in the future, mostly because processes (e.g. the Windows Event Viewer) can lock the event message file (the executable in our case), making it difficult to update the file.

Since embedding an event message file in a DLL is more flexible and significantly easier to accomplish, I’ll be covering this scenario here. The DLL won’t actually contain any executable code, it will simply serve as a container for the event definitions that will be stored inside the .dll file. While it may sound a little bit involved to build a DLL just for the purpose of having an event message file (especially to non-developers), you will see that it is actually surprisingly easy. There is absolutely no C/C++ coding required, and I also made a sample project available for download, which has everything setup and ready to go.

In a nutshell, the basic steps of creating an event message file are as follows:

1. Create a message file (e.g. messagefile.mc)
2. Convert the message file into a DLL, using mc.exe, rc.exe and link.exe

Once we have the message file, we will also need to register the event message file in the registry, and associate it with an event source. Keep in mind that the event source is not hard-coded into the message file itself, and in theory a single event message file could be associated with multiple event sources (as is the case with many event sources from Windows).

So let’s start by creating a working folder for the project, and I will call it “myapp_msgfile”. Inside that directory we’ll create the message file, let’s call it myapp_msgfile.mc. This file is a simple text file, and you can edit it with your favorite text editor (such as Ultraedit, Notepad2 or Notepad++).

The file with the .mc extension is the main message file that we’ll be editing – here we define our event ids, categories and so forth. Below is an example, based on the scenario from before. Explanations are shown inline.


MessageIdTypedef=WORD

LanguageNames=(
English=0x409:MSG00409
German=0x407:MSG00407
)

Here we define which languages we support, and by which files these languages will be backed. You will have to look up the language id for other languages if you plan on supporting more, and you can remove German if you only plan on supporting English.


MessageId=1
SymbolicName=MYTOOL_CATEGORY_GENERAL
Language=English
Tasks
.
Language=German
Jobs
.

Our first event id, #1, will be used for categories. Categories work in the exact same way as event ids. When we log an event to the event log and want to include a category, then we only log the number – 1 in this case.


MessageId=100
SymbolicName=TASK_OK
Language=English
Task %1 (%2) completed successfully.
.
Language=German
Job %1 (%2) war erfolgreich.
.

This is the first event description. The “MessageId” field specifies the event id, and the symbolic name is a descriptive and unique name for the event. The language specifies one of the supported languages, followed by the event message text. You end the event description with a single period – that period has to be the only character per line.


MessageId=101
SymbolicName=TASK_ERROR
Language=English
Task %1 (%2) failed to complete due to error “%3”.
.
Language=German
Job %1 (%2) konnte wegen Fehler “%3” nicht abgeschlossen werden.
.

MessageId=102
SymbolicName=TASK_INFO
Language=English
Task Information: %1
.
Language=German
Job Information: %1
.

Since we’re trying to create events for “custom task engine”, we need both success and failure events here. And voila, our event message file now has events 100 – 102, plus an id for a category.

So now that we have our events defined, we need to convert that into a DLL. The first step now is to use the message compiler, mc.exe, to create a .rc file as well as the .bin files. The message compiler will create a .bin file for every language that is defined in the mc file. Open the “Visual Studio Command Prompt (2010)” in order for the following commands to work:


mc.exe myapp_msgfile.mc

will create (for the .mc file depicted above):


myapp_msgfile.rc
msg00407.bin
msg00409.bin

With those files created, we can now create a .res (resource) file with the resource compiler rc.exe:


rc.exe /r myapp_msgfile.rc

which will create the


myapp_msgfile.res

file. The “/r” option instructs the resource compile to emit a .res file. Now we’re almost done, we’re going to let the linker do the rest of the work for us:


link -dll -noentry -out:myapp_msgfile.dll myapp_msgfile.res

The myapp_msgfile.res is the only input file to the linker, normally one would supply object (.obj) files to the linker to create a binary file. The “-noentry” option tells the linker that the DLL does not have an entry point, meaning that we do not need to supply a DllMain() function – thus the linker is satisfied even without any object files. This is of course desired, since we’re not looking to create a DLL that has any code or logic in it.

After running link.exe, we’ll end up with the long awaited myapp_msgfile.dll file.

The end. Well, almost. Our message file is at this point just a lone accumulation of zeros and ones, so we need to tell Windows that this is actually a message file for a particular event log and source. That’s done through the registry, as follows:

Open the registry editor regedit.exe. Be extremely careful here, the registry editor is a powerful tool, and needs to be used responsibly :-).

All event message files are registered under the following key:


HKLM\System\CurrentControlSet\Services\eventlog

Under this key, you will find a key for every event log as well as subkeys for every registered event source. So in essence, the path to an event source looks like this:


HKLM\System\CurrentControlSet\Services\eventlog\EVENTLOG\EVENTSOURCE

I’m going to assume here that we are going to be logging to the application event log, so we’d need to create the following key:


HKLM\System\CurrentControlSet\Services\eventlog\Application\MyApp

In this key, we need to following values:


TypesSupported (REG_DWORD)
EventMessageFile (REG_EXPAND_SZ)

TypesSupported is usually 7, indicating that the application will log either Information, Warning or Error events (you get 7 if you OR 1[error], 2[warning] and 4[information] together).

EventMessageFile is the path to your message DLL. Since the type is REG_EXPAND_SZ, the path may contain environment variables.

If you plan on utilizing categories as well, which I highly recommend (and for which our message file is already setup), then you need two additional values:


CategoryCount (REG_DWORD)
CategoryMessageFile (REG_EXPAND_SZ)

CategoryCount simply contains the total number of categories in your message file (1, in our case), and the CategoryMessageFile points to our message DLL. Make sure that your message file does not contain any sequence gaps, so if your CategoryCount is set to 10, then you need to have an entry for every id from 1 to 10 in the message file.

We could create separate message files for messages and categories, but that would be overkill for a small project like this.

Now that we have that fancy message DLL ready to go, we need to start logging. Below are some examples of how you can log to the event log with a scripting language. I’ll be covering Perl, Kix, and Python. Me being an old Perl fan and veteran, I’ll cover that first.

PERL
The nice thing about Perl is that you can take full advantage of insertion strings, so it can support event definitions containing more than one insertion string.


use strict;
use Win32::EventLog;


# Call this function to log an event

sub logMessage
{
my ($eventID, $eventType, @eventDetails) = @_;

my $evtHandle = Win32::EventLog->new(“Your Software Application”);

my %eventProperties;

   # Category is optional, specify only if message file contains entries for categories

$eventProperties{Category}      = 0;
$eventProperties{EventID}       = $eventID;
$eventProperties{EventType}     = $eventType;
$eventProperties{Strings}       = join("\0", @eventDetails);

$evtHandle->Report(\%eventProperties);

$evtHandle->Close;
}


# This is what you would use in your scripts to log to the event log. The insertion strings
# are passed as an array, so even if you only have one string, you would need to pass it
# within brackets (“This is my message”) as the last parameter

logMessage(100, EVENTLOG_INFORMATION_TYPE, (“Database Backup”, “Monitoring Database”, “Complete”));
logMessage(102, EVENTLOG_INFORMATION_TYPE, (“Step 1/3 Complete”));


PYTHON

Python supports event logging very well too, including multiple insertion strings. See the sample code below:


import win32evtlogutil
import win32evtlog


# Here we define our event source and category, which we consider static throughout
# the application. You can change this if the category is different

eventDetails = {‘Source’: ‘MyApp’,    # this is id from the message file
‘Category’: 1}        # which was set aside for the category


# Call this function to log an event

def logMessage(eventID, eventType, message, eventDetails):
if type(message) == type(str()):
message = (message,)
win32evtlogutil.ReportEvent(eventDetails[‘Source’], eventID, eventDetails[‘Category’], eventType, tuple(message))

logMessage(100, win32evtlog.EVENTLOG_INFORMATION_TYPE, (“Database Backup”, “Monitoring Database”), eventDetails)
logMessage(102, win32evtlog.EVENTLOG_INFORMATION_TYPE, (“Step 1/3 complete”), eventDetails)

KIXTART
The pro: Logging to the event log using KiXtart is so easy it’s almost scary. The con: It only supports message files that use one insertion string.


LOGEVENT(4, 102, "Database Backup", "", "MyApp")

How to REALLY monitor SMTP, POP3 and IMAP on Exchange 2003

Even though Microsoft Exchange Server 2010 has already been released, many organizations still use Exchange 2003. In this article I’ll explain how to thoroughly monitor the various Internet protocols that Exchange 2003 offers, including SMTP, POP3, IMAP (and NNTP for that matter). The reason why I’ll only be looking at Exchange 2003 is because there is a significant difference in architecture between Exchange 2003 and later versions.

It is a common misconception that you can effectively monitor the W3SVC service (commonly referred to as IIS, though IIS encompasses a lot more than just a web server) and other services provided through IIS, such as SMTP and POP3, by simply monitoring their associated service. It’s a misconception, because a given IIS-based service may contain multiple instances – most commonly the case with the World Wide Web Service which often hosts multiple independent web sites. The status of these instances can be controlled independently of the hosting service, though that service needs to be running of course.

Don’t despair though, most server-based windows applications, fortunately, can be monitored by ensuring that their respective service is – well – running. For example, to ensure that the Apache service is up, you “simply” make sure that the Apache service is running. The same goes for countless other services such as MySQL – even SQL Server (of course you can still detach individual databases in SQL Server).

Exchange 2003, due its partnership with the Internet Information Services 6.0, is different though. Yes, IIS and Exchange 2003 are tightly coupled, and if you intend to have your Exchange Server 2003 communicate with any other server using a standard Internet protocol such as SMTP, then you will need IIS.

eventlogblog_2010_01_exchange_iis_components.png

The screenshot above shows that the inetinfo.exe process hosts all the major services (bold name), and that each service can host one or more instance. For more details please see https://technet.microsoft.com/en-us/library/bb124674(EXCHG.65).aspx.

The three most common Internet services your Exchange 2003 server is running are probably SMTP, POP3 and IMAP4. While a lot of attention is being paid to the core Exchange services such as

• Microsoft Exchange Information Store (MSExchangeIS)
• Microsoft Exchange System Attendant (MSExchangeSA)

The services providing SMTP, POP3 and IMAP4 connectivity are usually similarly important, especially the SMTP service. Looking at the EventSentry service status page immediately reveals that the SMTP, POP3 and IMAP4 services are managed by IIS:

Thumbnail image for eventlogblog_2010_01_es_services.png

As you can see, IMAP4Svc, POP3Svc and SMTPSvc all use inetinfo.exe (Executable column) for their host process. So why is this important again?

Since all of these services support multiple instances INSIDE the service (inetinfo.exe), the host process will continue to run even when one or more instances inside the service are stopped. Since most installations only have one instance, stopping that one instance inside the service will still leave the service up and running. The effect of course is the same; the service is not available to the end users while the Windows service will happily continue to run.

A screen shot from the System Manager application shows instances listed inside:

eventlogblog_2010_01_system_manager.png

As you can see with the IMAP4 protocol, we have two virtual servers setup that are both hosted inside the “Microsoft Exchange IMAP4” service. To stubbornly illustrate my point further I took a screenshot that shows both IMAP4 instances stopped while the service itself is running:

eventlogblog_2010_01_system_manager_services.png

So I think we’re all in agreement now that monitoring the POP3, SMTP etc. services in Exchange 2003 is not enough if you want to ensure that these services are actually available. So how do we monitor all of these instances?
The easiest way is actually with a VBScript, which is included below. VBScript works well since the cscript.exe interpreter is readily installed on Windows 2003, so no additional installation of tools is required. The script enumerates all instances of a given protocol, and checks whether they are running or not. If at least one instance is not running, the tool will return 1, thus setting the ERRORLEVEL to 1.

This VBScript can then be embedded into EventSentry, which will then run the script at set intervals using the application scheduler, notifying you via email (with the proper filter setup) when an instance is stopped. There’s a screencast for that, you can view it at https://www.eventsentry.com/screencasts/eventsentry-application-scheduler/eventsentry-application-scheduler.htm. It shows you how to create an embedded script and setup EventSentry to notify you when the scripts returns an error. Note that the screencast uses an older version of the script which only monitored web sites (not SMTP, IMAP4, …), but the process of setting up the script with EventSentry is exactly the same.

You should be able to use the script as-is, just configure which protocols are monitored by adjusting the values in the “Define which protocols to monitor here” section. The script always prints all installed instances and their status, and any stopped instance is prefixed with an asterisk. Below is what an email from EventSentry looks like:

eventlogblog_2010_01_appscheduler_email.png

The line with the stopped instance won’t be yellow in the actual email, I just added this for readability. The script can also easily be modified to automatically start any stopped instances – simply add the line

Instance.Start

after line 102. This will still trigger an email (or error) to notify you that it was stopped, but a subsequent run of the script at the next monitoring interval should not trigger an error again if the start was successful.

A note of caution here though – I have seen the script hang indefinitely with this line added when an instance that is currently stopped can’t be started because it’s not configured correctly. Hence, it’s not included by default.


‘ Lists the state of all IIS protocols configured on the local machine
‘ and returns an %ERRORLEVEL% of 1, if at least one instance is not in
‘ the “Started” state.

‘ When scheduling this script with EventSentry’s application scheduler,
‘ make sure that the interpreter is set to “cscript.exe”

Option Explicit

Dim allInstancesAreRunning

Dim monitorSMTP, monitorPOP3, monitorIMAP4, monitorNNTP, monitorFTP, monitorWWW

‘ Define which protocols to monitor here

monitorSMTP  = 1
monitorPOP3  = 1
monitorIMAP4 = 1
monitorNNTP  = 1
monitorFTP   = 1
monitorWWW   = 1

‘ Define which protocols to monitor here

‘ ==================== EXECUTION STARTS HERE ====================
allInstancesAreRunning = EnumerateAllInstances

If allInstancesAreRunning = 0 Then
WScript.Echo vbCRLF & “WARNING: One or more IIS components are not running” & vbCRLF
End If

If allInstancesAreRunning = 0 Then
WScript.Quit 1
End If

‘ ==================== FUNCTIONS ====================
Function EnumerateAllInstances

EnumerateAllInstances = 1

If monitorSMTP = 1 Then
EnumerateAllInstances = EnumerateAllInstances And EnumerateInstances(“localhost”, “SMTPSVC”)
End If

If monitorPOP3 = 1 Then
EnumerateAllInstances = EnumerateAllInstances And EnumerateInstances(“localhost”, “POP3SVC”)
End If

If monitorIMAP4 = 1 Then
EnumerateAllInstances = EnumerateAllInstances And EnumerateInstances(“localhost”, “IMAP4SVC”)
End If

If monitorNNTP = 1 Then
EnumerateAllInstances = EnumerateAllInstances And EnumerateInstances(“localhost”, “NNTPSVC”)
End If

If monitorFTP = 1 Then
EnumerateAllInstances = EnumerateAllInstances And EnumerateInstances(“localhost”, “FTPSVC”)
End If

If monitorWWW = 1 Then
EnumerateAllInstances = EnumerateAllInstances And EnumerateInstances(“localhost”, “W3SVC”)
End If

End Function

Function MapServiceToInstance( Service )

If Service = “SMTPSVC” Then
MapServiceToInstance = “IIsSmtpServer”
ElseIf Service = “POP3SVC” Then
MapServiceToInstance = “IIsPop3Server”
ElseIf Service = “IMAP4SVC” Then
MapServiceToInstance = “IIsImapServer”
ElseIf Service = “W3SVC” Then
MapServiceToInstance = “IIsWebServer”
ElseIf Service = “NNTPSVC” Then
MapServiceToInstance = “IIsNntpServer”
ElseIf Service = “FTPSVC” Then
MapServiceToInstance = “IIsFtpServer”
End If

End Function

Function EnumerateInstances( Server, Service )
On Error Resume Next

Dim VirtualServerService
Dim Instance, InstanceID

EnumerateInstances = 1

Set VirtualServerService = GetObject(“IIS://” & Server & “/” & Service)

If Err.Number = 0 Then
InstanceID = MapServiceToInstance(Service)

For Each Instance in VirtualServerService

If Instance.KeyType = InstanceID Then

If SiteIsNotRunning(Instance.ServerState) Then
WScript.StdOut.Write “*”
EnumerateInstances = 0
End If

WScript.StdOut.Write Instance.ServerComment & ” (” & Service & “): ” & State2Desc(Instance.ServerState) & vbCRLF
End If
Next
End If

End Function

Function SiteIsNotRunning( nState )

If nState <> 2 Then
SiteIsNotRunning = 1
Else
SiteIsNotRunning = 0
End If

End Function

Function State2Desc( nState )

Select Case nState
Case 1
‘MD_SERVER_STATE_STARTING
State2Desc = “Starting”
Case 2
‘MD_SERVER_STATE_STARTED
State2Desc = “Running”
Case 3
‘MD_SERVER_STATE_STOPPING
State2Desc = “Stopping”
Case 4
‘MD_SERVER_STATE_STOPPED
State2Desc = “Stopped”
Case 5
‘MD_SERVER_STATE_PAUSING
State2Desc = “Pausing”
Case 6
‘MD_SERVER_STATE_PAUSED
State2Desc = “Paused”
Case 7
‘MD_SERVER_STATE_CONTINUING
State2Desc = “Continuing”
Case Else
State2Desc = “Unknown state”
End Select

End Function


You can also download the script from here.

Until next time,
Ingmar.

Announcing EventSentry v2.91

Now that EventSentry v2.91 has been released, I’m happy to have the opportunity to blog about our monitoring solution again.

The most significant new feature in EventSentry is the Health Matrix, a new way to see your network status in a space-efficient way. In fact, you can see the overall health status of your entire network on a single screen, even if it consists of hundreds of hosts.

We also made numerous other changes throughout the web reports, and added some exciting new filtering capabilities with our event log filters, as well as improved speed with the event log engine and file checksum generations.

EventSentry v2.91 also includes many minor improvements throughout the application, including service monitoring, process tracking and more. We have also updated EventSentry Light, and a new version will be released in the coming days after we have completed testing.

But now to the new features in version 2.91:

Health Matrix
In the health matrix, each host is displayed as a colored square, circle or rectangle, with the color indicating the overall health of the monitored computer. When all of the monitored components of a host are in an OK status, the color of the square is green. The color will change to orange or red when a problem is detected, depending on the number or severity of the issue.

clip0580.pngThe health matrix is highly customizable, for example both the size and shape of the icons can be adjusted depending on the size of the network (and your monitor).

clip0583.pngEvent Log Monitoring
In 2.91, the event log filtering engine was improved, resulting in reduced CPU usage of the event log monitoring component. Since the CPU usage of the EventSentry agent is already quite low, you will most likely only notice this improvement on hosts that generate an extremely large number of events, such as domain controllers.

Also new is the ability to filter events based on insertion strings in addition to just filtering based on the event message text. This means that one can now match individual strings inside event messages against strings, numbers, file checksums and group memberships. If you are not familiar with the term “insertion string”, then I highly recommend my previous post about event message files before you read on.

Consider the following hypothetical example: The environment-monitoring component of EventSentry logs event id 10908:

The temperature (78.21 degrees F) has fallen outside the configured range (60F to 76F).

which is defined as:

The temperature (%3 degrees %4) has fallen outside the configured range (%1%4 to %2%4).

This event obviously informs us, that the current temperature has exceeded a set limit. Now let’s say that we wanted to get an email when the temperature exceeds the limit, but also send a page when the temperature exceeds 90 degrees.

The new filtering feature allows you to do just that, by using the numerical comparison functionality with insertion strings (of course you would also need to set the hour/day properties). Assuming that you already have a filter in place for regular email notifications, you would simply setup an additional include filter that would evaluate insertion string 3 (%3) and only match if the number is above 90. See the screen shot below for the example. The result is a filter that only matches when then the temperature exceeds 90 degrees.

blog_es291_filter_1a.png2.91 also includes two more comparison options, file checksums and group membership. So, if an insertion string represents a filename (e.g. from a security event), then EventSentry can create a SHA checksum from the specified file and compare it with the value that you specified. Another example would be a security event that includes a username in an insertion string, in which case you could setup a filter that would only match if that user is a member of particular group you specify. Both examples are mostly applicable for security events, since those are most likely to contain either filenames or usernames.
Using file checksums, you can be notified whenever a user plays solitaire, even when the user renames the executable.

blog_es291_filter_2.pngSimply create a checksum of the file first using shachecksum.exe (included in the free NTToolkit, make sure you account for different OS versions and platforms) and intercept the corresponding 4688 event.

Service Monitoring

Service Monitoring now collects the username as well as the executable of a service. These additional properties are available in the web reports and in events generated, for example when the username of a service changes.

blog_es291_service_monitoring.pngSoftware Monitoring
Software monitoring has been overhauled in 2.91, and some limitations and bugs have been removed. On Vista, Win2k8 and later, Windows patches are now monitored and included in the software inventory. 64-bit software is now classified as such and searchable, and searching for installed Windows Updated patches has also been simplified.

SNMP Traps
EventSentry can now send version 2c and version 3 traps, previously only version 1 traps were sent by the agent. The SNMP trap daemon was originally set to be released as part of 2.91, but this feature has been pushed back to v2.92.

Web Reporting
We have made a number of improvements in the web reporting to make using our web-based interface easier:

•    Reports are now easily accessible from every page, in addition to the reports p
age.
•    The database usage page now shows the actual page name in addition to the table name.
•    The dashboard page has been overhauled
•    The network status page can be customized (performance counters & disks)

blog_es291_dashboard.pngMiscellaneous Improvements

There have of course been other improvements across the board, such as:

•    Notes can now be applied to computers
•    AD-linked groups can be sorted, and authentication properties can be set globally
•    Hardware monitoring now includes the IP address of an interface
•    Process tracking can capture the command line of a process
•    Logon tracking includes group information
•    File checksum generation has been optimized and will now use fewer CPU resources (affects file monitoring and file access tracking)
•    The minimum database interval for environment monitoring has been reduced to 5 minutes from 15 minutes
•    Software uninstallation events now include the same information as software installation events

If you have an active maintenance agreement, then this 2.91 release will of course be free of charge. If you are not already using EventSentry, then you can download a free 30-day evaluation version from https://www.eventsentry.com/downloads_downloadtrial.php.

Happy Holidays,
Ingmar.

Group Policy Software Deployment: Targeting the right computers with WMI filters

Group policy was introduced with Windows 2000, and is an easy way of centralizing many Windows settings. In addition to centralizing event log and firewall settings, I personally like the ability to deploy MSI-based software applications with Group Policy, since it makes it extremely easy to deploy new software packages.

Even though Software Installation only works only with MSI-based packages, it does make deploying MSI-based software packages extremely easy. Here is a short list of software (mostly tools for sysadmins) that you can deploy using Active Directory:

There are of course many more, and you can distribute most Microsoft client applications, such as Microsoft Office, through Group Policy as well.

We generally deploy software through Group Policy when three or more computers use it, since it’s very easy to create a new package (if you already have a network share etc. setup, then you can literally do it in 2 minutes).

grouppolicy_software_installation.pngBefore I list some of the useful WMI queries we use to target certain operating systems or computer types, there are a couple of things to note for those who are new to software deployment via group policy:

  • Software packages are always installed right after a reboot, so they’re mostly suitable for workstations.
  • The network share which hosts the MSI files needs to give the computer accounts (e.g. DESKTOP1$) at least read access. Generally, giving EveryOne Read access works well unless you have a reason to restrict access to the software packages that you distribute.

Since the mechanism to distribute software is based on group policies, any sort of software package you create inside a group policy, will need to be assigned to an organizational unit (OU).

Since OUs can contain a large amount of computers that might not all need that particular software package, you can use two techniques to narrow down which computers receive the software:

  1. Security Filtering
  2. WMI Filtering

Security Filtering
With this method, you create a security group in ActiveDirectory, place the computers that should get a particular software package into the group, and then specify this group in the Security Filtering list.

The screen shot below shows a group policy that will only be applied to members of the “Source Control Computers” group:


grouppolicy_security_filtering.png

WMI Filtering
With this method, you can filter the computers which are affected by your policy, based on common properties of the Operating System. For example, some packages might distinguish between 32-bit and 64-bit, some packages might only work on Vista or later, whereas other packages apply only to servers. With WMI, you can target the right computers without having to mess with group memberships (though you will probably still need to do that). For example:

  • 32-bit vs. 64-bit computers
  • only workstations
  • only computers running a certain OS
  • only computers with a certain amount of RAM
  • only computers of a certain brand

With WMI filtering, you just create the software group policy, for example:

  • 7-Zip 32-bit
  • 7-Zip 64-bit

and then apply the respective WMI filter to them. But lets cut to the chase, here are a few WMI queries that you can cut & paste:

Operating System 32-bit


Select * from Win32_Processor where AddressWidth = ’32’

Operating System 64-bit

Select * from Win32_Processor where AddressWidth = ’64’

grouppolicy_wmi_filter.pngWorkstation

Select * from WIN32_OperatingSystem where ProductType=1

Domain Controller

Select * from WIN32_OperatingSystem where ProductType=2

Server

Select * from WIN32_OperatingSystem where ProductType=3

Some filters require multiple WMI queries, which are just chained together.

Workstation 32-bit

Select * from WIN32_OperatingSystem where ProductType=1


Select * from Win32_Processor where AddressWidth = ’32’

Workstation 64-bit

Select * from WIN32_OperatingSystem where ProductType=1


Select * from Win32_Processor where AddressWidth = ’64’

grouppolicy_wmi_filter_multiple.pngWindows XP

Select * from WIN32_OperatingSystem where Version like ‘5.1.%’ and ProductType=1

Windows Vista

Select * from WIN32_OperatingSystem where Version like ‘6.0.%’ and ProductType=1

Windows 7

Select * from WIN32_OperatingSystem where Version like ‘6.1.%’ and ProductType=1

Windows 2003

Select * from WIN32_OperatingSystem where Version like ‘5.2.%’ and ProductType>1

Windows 2008

Select * from WIN32_OperatingSystem where Version like ‘6.0.%’ and ProductType>1

Windows 2008 R2

Select * from WIN32_OperatingSystem where Version like ‘6.1.%’ and ProductType>1

WIN32_OperatingSystem of course includes more information that can be useful for WMI queries, such as a descriptive name of the installed OS (“Name”) as well as the service pack installed (“ServicePackMajorVersion”).

Manufacturer (e.g. DELL)

Select * from WIN32_ComputerSystem where Manufacturer = ‘DELL’

Installed Memory (e.g. more than 1Gb)

Select * from WIN32_ComputerSystem where TotalPhysicalMemory >= 1073741824

Like I mentioned earlier, this is merely a small sample of the possible WMI queries one can use to filter group policies, but they should cover most relevant scenarios. Feel free to suggest other useful WMI queries and I will include them here.

For more information, check out these resources on WMI:

WMI
Secrets of Windows Management Instrumentation
Scriptomatic (Vista/Win2k8/Win7: run as administrator!)

Happy querying,
Ingmar.