Mobile Alerts: Pushing EventSentry alerts directly to your mobile devices with Prowl and NMA

When it comes to mobile alerts, email seems to still be the prevalent method of choice for many IT pros. There are many good reasons why network alerts delivered via email are convenient:

  • easy to configure
  • uses existing infrastructure
  • every smartphone and tablet supports email
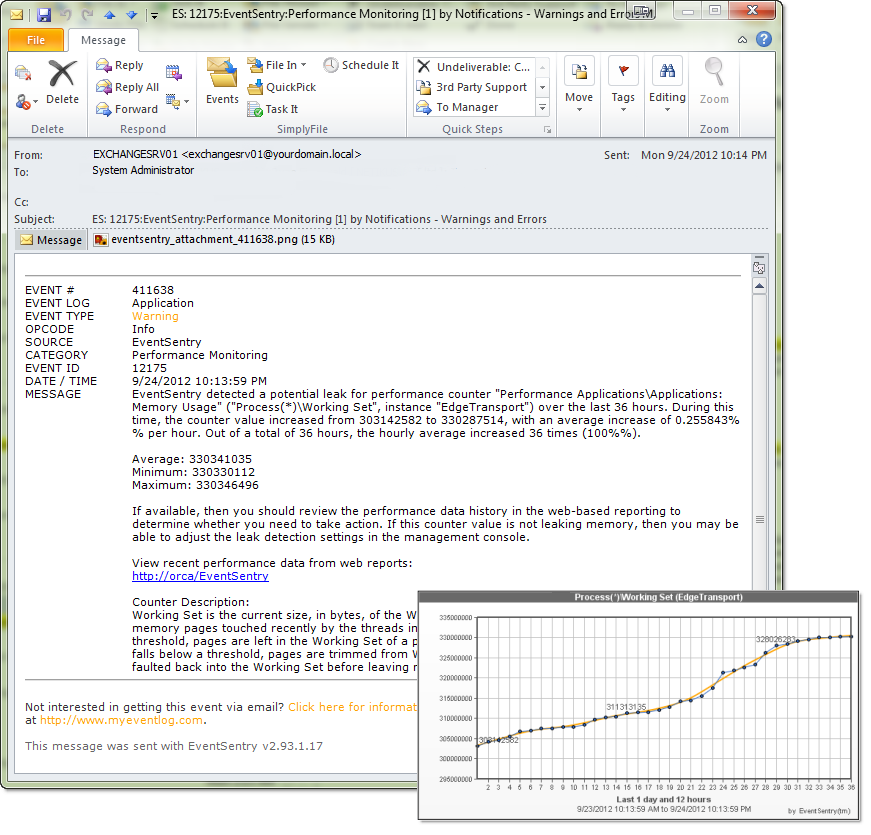
  • supports attachments (e.g. performance charts from EventSentry’s performance alerts)
  • integrates into your existing environment – everybody already uses email!

What’s not to like? Well, of course it turns out that some of these advantages can also be a disadvantage:

  • emails are not real time
  • problems on the email server often don’t surface immediately
  • important alerts can be overlooked in the inbox jungle
  • you cannot be alerted about email problems via email (duh!)

Viable Email Alternatives
Thankfully, there are a number of alternatives that can be used as an email substitute or addition for mobile alerts. In this article I’ll focus on two affordable services: Prowl (for the iOS platform) and Notify My Android (you may have guessed it – for the Android platform) – subsequently referred to as “NMA”. Both of these services consist of apps for their respective platform and a web-based back end which will push the notifications to your device(s) in near real time.

Mobile Alert on iPhone 5 with Prowl
EventSentry event sent to Prowl on an iPhone

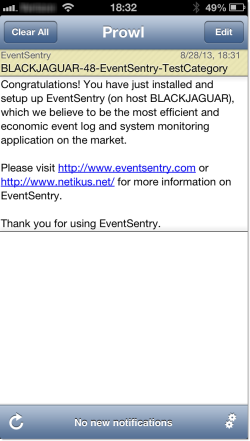
Both services offer an HTTP API which we can connect to with EventSentry’s HTTP action. If you have never used the HTTP action in EventSentry, then here is some background: the HTTP action allows you to POST any event (whether it be an event from the security event log or a heartbeat alert for example) to either Prowl’s or NMA’s web service. These notifications are then pushed to one or more mobile devices.

Neither service currently requires a monthly subscription, but both require a purchase (Prowl costs USD 2.99 whereas NMA costs USD 4.99) if you want to send unlimited notifications to your mobile device(s). NMA is a little more welcoming to strangers – it supports up to 5 notifications per day at no charge.

Prowl: Getting Started
The iOS app costs USD 2.99, and supports up to 1000 API calls (=notifications) per hour. To get started:

  1. Purchase the Prowl: Growl Client from the Apple App Store and install it
  2. Register for free at prowlapp.com
  3. Login & create an API key

Notify My Android (NMA): Getting Started
The Notify My Android app is free in the Google Play store and supports up to 5 API calls (=notifications) per day  for free. Upgrading to a premium account will allow up to 800 API calls per hour. To get started:

  1. Download the Notify My Android app from the Google Play store
  2. Register for free at www.notifymyandroid.com
  3. Login & create an API key
  4. Optional: Upgrade to a Premium account to allow for unlimited notifications

Once you have the mobile app installed and the API key in hand, you can start setting up a HTTP action in EventSentry. Notifications essentially consist of three fields: The application name, a subject as well as a message field, all of which can be customized. As such, it’s up to you configure which part of an event log alert you will put in the subject, and which part you will put into the actual message. In our example, we generate a dynamic notification subject with the host name, event id, event source and event category. The notification body will simply consist of the event message text, though this can be customized as well.

Setting up a HTTP action
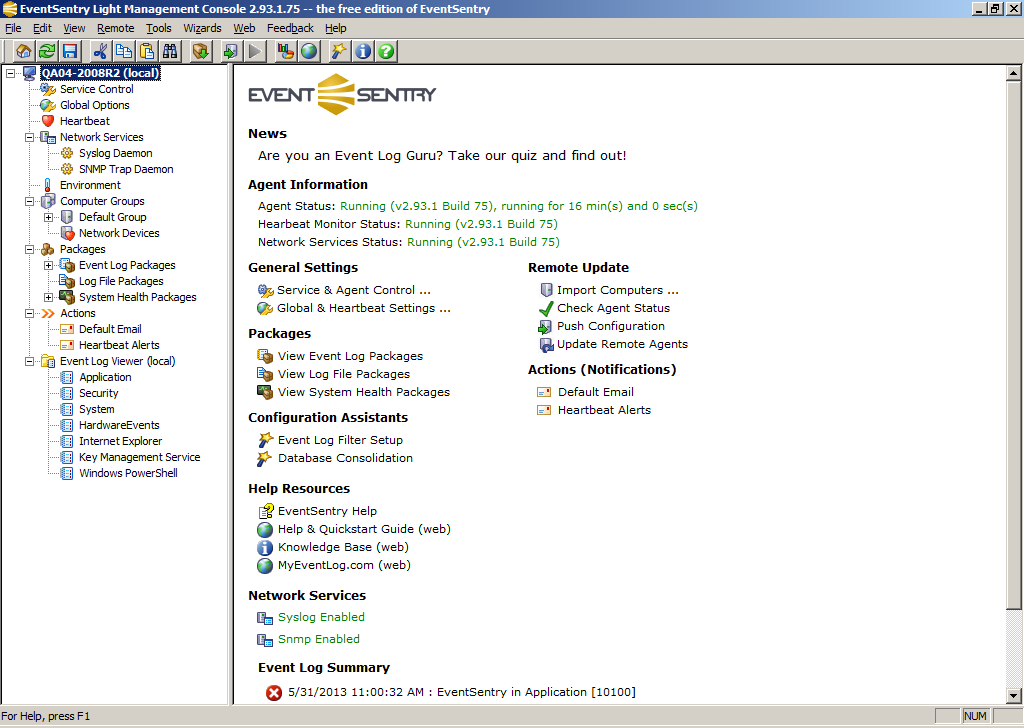
Right-click the “Actions” container (or, in v3.0, use the “Add” button in the Ribbon) and create a new HTTP action. The HTTP action requires a URL at minimum, optional credentials and the actual data fields to submit in the HTTP POST. Conveniently, both Prowl & NMA use the same field names. I suspect that they are adhering to some sort of standard, though I couldn’t find any references.

The first parameter to configure is the URL, which depends on the service you use:

Prowl: https://api.prowlapp.com/publicapi/add
NMA: https://www.notifymyandroid.com/publicapi/notify

Configuring authentication credentials is not necessary since you are essentially authenticating with the API key you generated. The last step is configuring the form fields. The bold field on the left is the name of the form element and the text to the right the value. A description follows in italic on the next line:

apikey: abdef123123abababafefefe
The API key you received

application: EventSentry
This will displayed as part of the notification. I use “EventSentry” here, but this can really be anything, so it could be the host name as well for example ($EVENTCOMPUTER)
Max Length: 256

event: $EVENTCOMPUTER-$EVENTID-$EVENTSOURCE-$EVENTCATEGORY
This is the subject of the notification. You can use any variables, including insertion strings $STR1, $STR2 etc.
Max Length: 1024 [Prowl], 1000 [NMA]

description: $EVENTMESSAGE
This is the main message body of the notification, the $EVENTMESSAGE seems like a pretty good candidate for this field
Max Length: 10000

priority: 0 (possible values are -2, -1, 0, 1 and 2)
This field is optional and doesn’t do anything with NMA. With Prowl however, a priority can be set to “2” (indicating an “emergency”) which may then override quiet hours on the mobile app (if quiet hours are configured in the Prowl mobile app).

Take a look at the respective API documentation for Prowl and NMA as well; each show additional fields which can be configured, as well as additional information that you may or may not find useful.

The screenshot below shows a fully configured HTTP action for Prowl:

EventSentry HTTP Action for Prowl

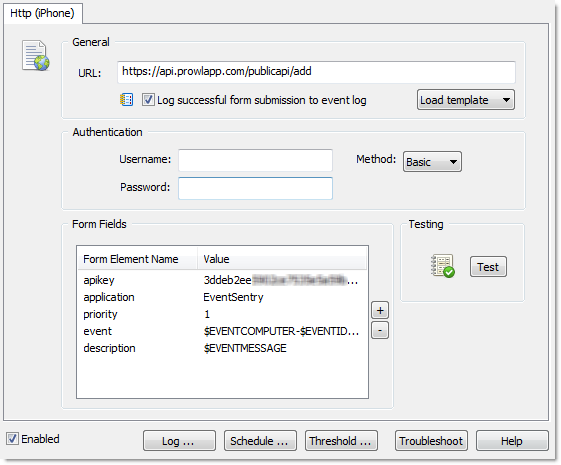
The HTTP action for NMA would look identical, with the exception of the URL which is different. You can click the “Test” button, which will submit the configured data to the specified URL and should, when configured correctly, immediately generate a notification on the mobile device. Please note that event variables will not be resolved when testing.

Threshold
To make sure that your mobile device doesn’t get flooded with alerts (some applications have the tendency to generate not one but hundreds of events in a short period of time), I highly recommend that you setup a threshold on the action or the event log filter referencing the action (I personally prefer the former). You can also setup a schedule so that notifications are only sent on certain days and/or during certain hours.

The last step would be to configure an event log filter to forward select events to the mobile device, something that is beyond the scope of this article. See the tutorials below for more information:

Reliability
It seems only natural to wonder whether alerts sent through these services can be used for mission critical systems. I’ve been using mostly Prowl as I’m an iPhone user, and have been very happy with it’s fast response times (which are almost instant), the service reliability and the stability of the iOS app. Nevertheless, both prowlapp.com and NMA state that you should not solely rely on their system for critical alerts and instead setup multiple channels for mission critical alerts. This sounds nice in theory, but suspect that most sysadmins will not want to dismiss alerts on more than one device – something that can get old if you get a fair number of alerts. Switching to a commercial system like PagerDuty with guaranteed up-time may be preferable in that case. I will talk more about PagerDuty in an upcoming post soon.

My experience with the NMA Android app wasn’t as good during the limited testing I performed. While it worked great when it worked, the app did crash on me a couple of times.

Conclusion
If you’re looking for a way to push alerts to your mobile device from EventSentry without using email and without spending big bucks, Prowl and NMA are worth looking into. They’re affordable, responsive and easy to configure.

EventSentry Light Supercharged

The latest EventSentry update brings significant and very exciting changes to the free light edition, EventSentry Light.

We have always seen EventSentry Light as a successor to the original EventwatchNT – a monitoring tool for small networks to alert sysadmins by sending real-time alerts about event log activity. As its big brother EventSentry continued to mature, most features from EventSentry made it into the light edition as well: Service Monitoring, Disk Space Monitoring, Performance Monitoring and many more. Since EventSentry Light was, and continues to be, free, it needed to distinguish itself from the commercial edition. As such, most feature were somewhat restricted in the light edition which only allowed a limited number of packages, event log filters, performance counters and such.

es_light.png

Over the last year we’ve been getting feedback that EventSentry Light was being constrained too much. Since our goal is, and always has been, to empower sysadmins and not constrain them, we decided to provide our users with more functionality in the free edition. The result of these efforts is build 2.93.1.75, and with this release you can:

  • Monitor event logs and log files in real time, setting up as many filter rules as you’d like, without restrictions.
  • Utilize all advanced event log filter capabilities like thresholds, timers, schedules and more!
  • Create as many event log, log file and system health packages as you like.
  • Utilize all system health monitoring features, such as file checksum monitoring, performance monitoring, service monitoring and more.
  • Create a variety of alerts using mail, HTTP, SNMP traps, Syslog messages and more.
  • Receive SNMP traps from SNMP v3 enabled devices.
  • Monitor up to 2 full hosts and 2 network devices.

Pretty impressive, no? So literally overnight, EventSentry Light has matured into a full-fledged monitoring solution which will alert IT professionals like sysadmins of critical (event) log events, performance issues and much more. What differences with EventSentry remain? A few, but the line is much more clear now:

  1. Reporting. With EventSentry, you get log consolidation, software/hardware inventory, performance trend reports, network dashboards, jobs, JSON/XML/CSV/… APIs and more.
  2. Compliance. EventSentry includes a variety of compliance functionality such as process tracking, logon tracking, account management tracking and more.
  3. Monitor multiple hosts. Monitor as many hosts as you are licensed for, and also utilize command line utilities to automate remote host management.
  4. Support. EventSentry includes quality email and phone support, something we pride ourselves on. EventSentry Light offers forum support.
  5. Mobile iPhone & Android apps are only available in the full edition since they require reporting.

So if you’re not already using EventSentry Light, or using an older version, then you should give it a try. It’s as free as it gets with no registration required, no advertisements and no nagging pop-ups. We hope you like it as much as we do. And did I mention that you can seamlessly upgrade from EventSentry Light to EventSentry? 🙂

Don’t forget to check out our other free tools and Facebook / Google+ pages!
Best,
Ingmar.

Announcing EventSentry Light v2.93.1

We’re excited to announce a new version of EventSentry Light, our free server and log monitoring solution.

EventSentry Light is:

  • completely free
  • does not show ads
  • does not require a registration
  • does not expire

To see all the new features which were added to full release EventSentry v2.93.1, see “EventSentry v2.93.1 – Part 1” and “EventSentry v2.93.1 – Part 2“.

eventsentry_performance_alert.png

In addition to the new features and bug fixes of the 2.93.1 release, we also decided to make the latest version of EventSentry Light even more useful for sysadmins by enabling several features which were previously only available in the full version:

  • Process Action is now available, so you can now launch scripts and/or processes as a response to event log entries
  • Custom event logs as well as custom event log channels (Windows 2008 and later) can now be monitored
  • Services can now be controlled in addition to just being monitored
  • All event logs can now be backed up
  • Event Log backups can be compressed
  • NTP (Network Time Protocol) feature can now adjust the local time
  • Limits can now be applied to actions
  • Email actions: All features are now available
  • Import/Export feature in management console is now available
  • Variables support is now available

In addition to the above new functionality, we also increased many of the existing limitations:

  • # of event log filters: Increased to 5 (from 4)
  • # of monitored services: Increased to 6 (from 4)
  • # of event log backup schedules: Increased to 3 (from 2)
  • # of actions: Increased to 3 (from 2)

EventSentry Light v2.93.1 is a significant upgrade from v2.92, with many new features now available to light users. Remember, with EventSentry Light you can:

So if you’re running EventSentry Light v2.92 or older then the time to upgrade is now! If you’re not using EventSentry at all, then the time to install it is now – you have nothing to loose.


Get EventSentry Light

How to make the Windows Software RAID log to the event log

Windows Server has long provided admins the ability to create a software RAID, enabling redundant disks without a (potentially expensive) hardware RAID controller. If you are already using Windows Server 2008’s software RAID capabilities, and think that Windows will somehow notify you when a disk in an array fails, then you can skip to “Just say something!” below.

Background
Creating a RAID can all be done from Disk Management view in the Computer Management console, without any scripting or command-line tools.

Software RAIDs are not as powerful and fast as their hardware counterparts, but are nevertheless a good way to enable disk redundancy. Software RAIDs make sense in a variety of scenarios:

•    When you are on a budget and don’t want to spend a few hundred $$ on a hardware RAID controller
•    When you need to enable redundancy on a server that wasn’t originally designed with redundancy in mind (as if that would ever happen!)
•    When you need to add redundancy to a server without reinstalling the OS or restoring from backup

Windows Server lets you do all this, and it’s included with the OS – so why not take advantage of it? The last point is often overlooked I think – you can literally just add a hard disk to any non-redundant Windows server and create a mirror – with less than dozen clicks!

Since this article is starting to sound like a software raid promotion, and for the sake of completeness, I am listing SOME of the advantages of a hardware RAID here as well:

•    Faster performance due to dedicated hardware, including cache
•    More RAID levels than most software RAIDs
•    Hot-plug replacement of failed disks

•    Ability to select a hot spare disk
•    Better monitoring capabilities (though this article will alleviate this somewhat)

But despite being far from perfect, software RAIDs do have their time and place.

Just Say Something Please!
Unfortunately, despite all the positive things about software RAID, there is a major pitfall on Windows 2008: The OS will not tell you when the RAID has failed. If the RAID is in a degraded state (usually because a hard disk is dead) then you will not know unless you navigate to the Disk Management view. The event logs are quiet, there are no notifications (e.g. tray), and even WMI is silent as a grave. Nothing. Nada. Nix.

What’s peculiar is that this is a step back from Windows 2003, where RAID problems were actually logged to the System event log with the dmboot and dmio event sources. What gives?

Even though a discussion on why that is (or is not) seems justified, I will focus on the solution instead.

The Solution

Fortunately, there is a way to be notified when a RAID is “broken”, thanks in part to the diskpart.exe tool (which is part of Windows) and EventSentry. With a few small steps we’ll be able to log an event to the event log when a drive in a software RAID fails, and send an alert via email or other notification methods.

Diskpart is pretty much the command-line interface to the Disk Management MMC snap-in, which allows you to everything the MMC snap-in does – and much more! One of the things you can do with the tool is to review the status of all (logical) drives. Since we’re interested as to whether a particular RAID-enabled logical drive is “Healthy”, we’ll be looking at logical drives.

So how can we turn diskpart’s output into an email (or other) alert? Simple: We use EventSentry‘s application scheduler to run diskpart.exe on a regular basis (and since the tool doesn’t stress the system it can be run as often as every minute) and generate an alert. The sequence looks like this:

•    EventSentry runs our VBScript (which in turn runs diskpart) and captures the output
•    When a problem is detected, EventSentry logs an error event 10200 to the application event log, including output from step 1.
•    An event log filter looks for a 10200 error event, possibly looking at the event message as well (for custom routing).

Diskpart
Diskpart’s output is pretty straightforward. If you just run diskpart and execute the “list volume” command, you will see output similar to this:


Volume ###  Ltr  Label        Fs     Type        Size     Status     Info
----------  ---  -----------  -----  ----------  -------  ---------  --------
Volume 0         System Rese  NTFS   Simple       100 MB  Healthy    System
Volume 1     C                NTFS   Mirror       141 GB  Healthy    Boot
Volume 2     D   System Rese  NTFS   Simple       100 MB  Healthy           

disk_management_3_cropped.png

Notice the “Status” column, which indicates that our “BOOT” volume is feeling dandy right now.  However, when a disk fails, the status is updated and reads “Failed Rd” instead:


Volume ###  Ltr  Label        Fs     Type        Size     Status     Info
----------  ---  -----------  -----  ----------  -------  ---------  --------
Volume 0         System Rese  NTFS   Simple       100 MB  Healthy    System
Volume 1     C                NTFS   Mirror       141 GB  Failed Rd  Boot
Volume 2     D   System Rese  NTFS   Simple       100 MB  Healthy           

Technically, scripting diskpart is a bit cumbersome, as the creators of the tool want you to specify any commands to pass to diskpart in a text file, and in turn specify that text file with the /s parameter. This makes sense, since diskpart can automate partitioning, which can certainly result in a dozen or so commands.

For our purposes however it’s overkill, so we can trick diskpart by running a single command:

echo list volume | diskpart

which will yield the same results as above, without the need of an “instruction” file.

The easy way out
The quickest way (though per usual not the most elegant) to get RAID notifications is to create a batch file (e.g. list_raid.cmd) with the content shown earlier

echo list volume | diskpart

and execute the script on a regular basis (e.g. every minute) which will result in the output of the diskpart command being logged to the event log as event 10200.

Then, you can create an include filter in an event log package, which will look for the following string:

*DISKPART*Status*Failed Rd*

If your EventSentry configuration is already setup to email you all new errors then you don’t even have to setup an event log filter – just creating the script and scheduling it will do the trick.

But surely you will want to know how this can be accomplished in a more elegant fashion? Yes? Excellent, here it is.

A Better Solution

One problem with the “easy way out” is that it will not detect all Non-Ok RAID statuses, such as:

•    At Risk
•    Rebuild

disk_management_resync.pngFurthermore, the output can be rather verbose, and will include any logical drive, include CD-ROMs, removable disks and others.

It is for this reason we have created a VBScript, which will parse the output of the diskpart command with a regular expression, and provide the following:

•    A filtered output, showing only drives in a software raid
•    Formatted output, showing only relevant drive parameters
•    Detecting any Non-Healthy RAID

Alas, an example output of the script is as follows:

Status of Mirror C: (Boot) is "Healthy"

Much nicer, isn’t it? If a problem is detected, then output will be more verbose:

**WARNING** Status of Mirror C: (Boot) is "Failed Rd"

WARNING: One or more redundant drives are not in a “Healthy” state!

The VBScript will look at the actual “Status” column and report any status that is not “Healthy”, a more accurate way to verify the status of the RAID.

Since the script has a dynamic ERRORLEVEL, it’s not necessary to evaluate the script output – simply evaluating the return code is sufficient.

Implementation
Let’s leave the theory behind us and implement the solution, which requires only three steps:

1.    Create an embedded script (we will include this script with v2.93 by default) through the Tools -> Embedded Scripts option, based on the VBScript below. Select “cscript.exe” as the interpreter. Embedded scripts are elegant because they are automatically included in the EventSentry configuration – no need to manage the scripts outside EventSentry.

monitor_raid_embedded_script.png
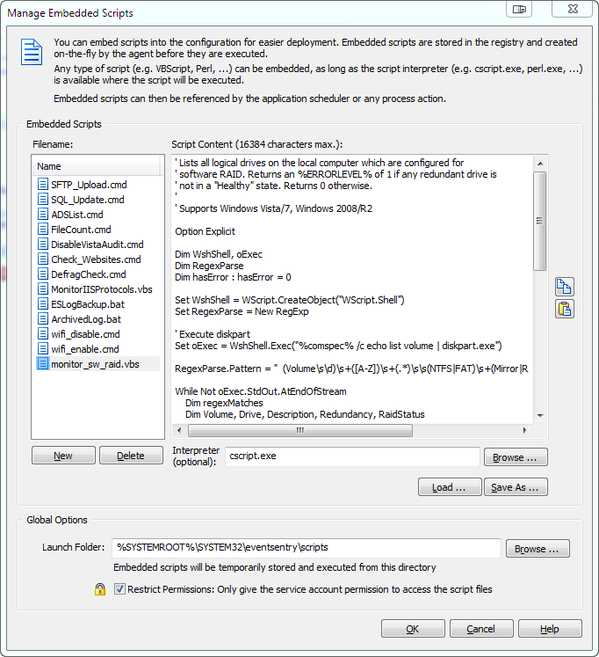
2.    Create a new System Health package and add the “Application Scheduler” object to it. Alternatively you can also add the Application Scheduler object to an existing system health package. Either way, schedule the script with a recurring schedule.

application_scheduler_monitor_raid.png
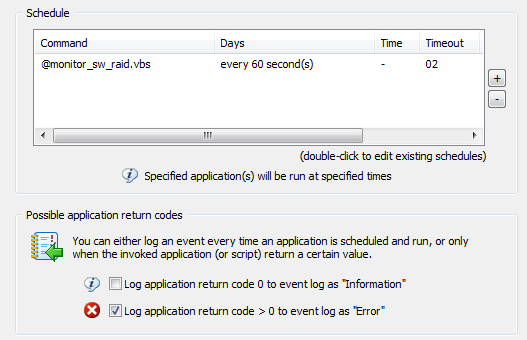
Note that commands starting with the @ symbol are embedded scripts. The “Log application return code 0 to event log …” option is not selected here, since the script runs every minute and would generate 1440 entries per day. You may want to enable this option first to ensure that your configuration is working, or if you don’t mind having that many entries in your application log. It’s mainly a matter of preference.

3.    This step is optional if you already have a filter in place which forwards Errors to a notification. Otherwise, create an event log filter which looks for the following properties:

Log: Application
Severity: Error
Source: EventSentry
ID: 10200
Text (optional): “WARNING: One or more redundant drives*”


The VBScript

' Lists all logical drives on the local computer which are configured for 
' software RAID. Returns an %ERRORLEVEL% of 1 if any redundant drive is 
' not in a "Healthy" state. Returns 0 otherwise.
'
' Supports Windows Vista/7, Windows 2008/R2

Option Explicit

Dim WshShell, oExec
Dim RegexParse
Dim hasError : hasError = 0

Set WshShell = WScript.CreateObject("WScript.Shell")
Set RegexParse = New RegExp

' Execute diskpart
Set oExec = WshShell.Exec("%comspec% /c echo list volume | diskpart.exe")

RegexParse.Pattern = "\s\s(Volume\s\d)\s+([A-Z])\s+(.*)\s\s(NTFS|FAT)\s+(Mirror|RAID-5)\s+(\d+)\s+(..)\s\s([A-Za-z]*\s?[A-Za-z]*)(\s\s)*.*"

While Not oExec.StdOut.AtEndOfStream
Dim regexMatches
Dim Volume, Drive, Description, Redundancy, RaidStatus
Dim CurrentLine : CurrentLine = oExec.StdOut.ReadLine

Set regexMatches = RegexParse.Execute(CurrentLine)
If (regexMatches.Count > 0) Then
Dim match
Set match = regexMatches(0)

If match.SubMatches.Count >= 8 Then
Volume = match.SubMatches(0)
Drive = match.SubMatches(1)
Description = Trim(match.SubMatches(2))
Redundancy = match.SubMatches(4)
RaidStatus = Trim(match.SubMatches(7))
End If

If RaidStatus <> "Healthy" Then
hasError = 1
WScript.StdOut.Write "**WARNING** "
End If

WScript.StdOut.WriteLine "Status of " & Redundancy & " " & Drive & ": (" & Description & ") is """ & RaidStatus & """"
End If
Wend

If (hasError) Then
WScript.StdOut.WriteLine ""
WScript.StdOut.WriteLine "WARNING: One or more redundant drives are not in a ""Healthy"" state!"
End If

WScript.Quit(hasError)

How to dynamically toggle your Wireless adapter with EventSentry

Most of the time I work on a Lenovo laptop running Windows 7, and I’m overall quite happy with the laptop (especially after the mainboard was replaced and it stopped randomly rebooting). However, a minor nuance had been bugging me for a while: If I plugged my computer into a LAN (I have a docking station at work and at home) while a wireless signal was also available (and configured on the laptop), Windows 7 would keep both connections active.

1. The Problem

So I’d have my laptop in the docking station, connected to a 1Gb Ethernet network, and yet the laptop would also be connected to a WiFi network. While not a big deal per se, it does have a few advantages to automatically disable the WiFi connection when already connected to Ethernet:

  • Avoid potential connectivity issues
  • Increase security by not transmitting data via Wifi when not necessary
  • Increase battery life when connected to a LAN
  • Because you can!

Now, Lenovo equips most (if not all) laptops with a software called “Access Connections”, a pretty nifty and free tool! One of the things it can do, is disable a Wireless adapter when the computer is connected to Ethernet. However, it never re-enables it when you disconnect from the wired network (at least I haven’t found a way), and besides not everybody has Lenovo laptop.

So how could I disable the WiFi connection automatically when I connected the laptop to an Ethernet, yet automatically re-enable it when there is no Ethernet connection?

2. The Research

After some intense brainstorming, I remembered two things:

  1. Most Ethernet NIC drivers log event to the System event log when a network port is connected/disconnected.
  2. A while back, I used the netsh command to configure DNS servers from the command line. Maybe one could toggle the state of network adapters with this tool as well?

3. Evidence Gathering

The first one was easy, a quick look at the system event log revealed the following event:

e1kexpress_event.png
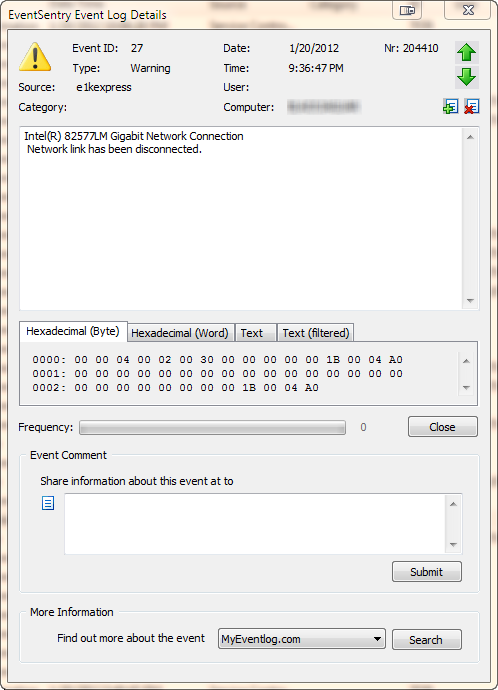
A similar event is logged when the “network link” has connected. The event shown here is specific to the driver of my laptop’s network card (an Intel(R) 82577LM adapter), but most newer drivers will log events when a cable is disconnected or the link is otherwise lost. If you are already running EventSentry with its hardware inventory feature enabled, then you can obtain the name of the network adapter from any monitored host on the network through the hardware inventory page, an example is shown below.

all_nics.png
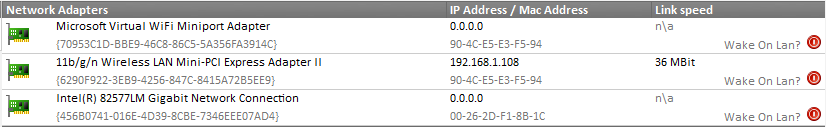
Coming up with a way to enable and disable a particular network connection with netsh.exe was a bit more challenging, but I eventually cracked the cryptic command line parameters of netsh.exe.
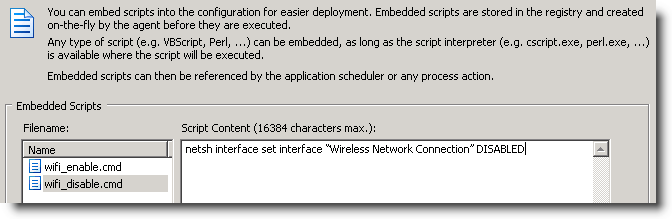
Enable a connection
netsh interface set interface “Wireless Network Connection” ENABLED

Disable a connection

netsh interface set interface “Wireless Network Connection” DISABLED

And yes, you do need to specify the word “interface” twice. If you do find yourself wanting to automate network adapter settings with scripts and/or the command line frequently, then you should check out this link.

4. The Solution

So now that we have all the ingredients, let’s take a look at the recipe. In order to accomplish the automatic interface toggling, we need to create:

  • an embedded script called wifi_enable.cmd, using the command line from above
  • an embedded script called wifi_disable.cmd, again using the command line from above
  • a process action “Wifi Enable”, referencing the above wifi_enable.cmd embedded script
  • a process action “Wifi Disable”, referencing the above wifi_disable.cmd embedded script
  • an event log filter for event source “e1kexpress” and event id 27, triggering the “Wifi Enable” action
  • an event log filter for event source “e1kexpress” and event id 32, triggering the “Wifi Disable” action

A couple of clarifications: First, you do not need to use embedded scripts, you can create the scripts in the file system too and then point the process action to those files. I prefer embedded scripts since I don’t have to worry about maintaining the script, as it gets distributed to remote hosts automatically when needed. Second, the event source and event id will depend on the network card you have installed on your network, the above example will only work with Lenovo T410 laptops.

So what happens is pretty straightforward: When I connect my laptop to a LAN, the Intel NIC driver writes event id 32 with the event source e1kexpress to the system event log. EventSentry intercepts the event and triggers the Wifi Disable action, which in turns runs the netsh.exe process, disabling the WiFi connection.

5. Setting it up in the management console

Embedded Scripts

You can manage embedded scripts via Tools -> Embedded Scripts. Click “New”, specify a descriptive name (e.g. wifi_enable.cmd) and paste the command line netsh interface set interface “Wireless Network Connection” ENABLED into the script content window. Then, do the same for the wifi_disable.cmd script, but this time use the netsh interface set interface “Wireless Network Connection” DISABLED command line. You can leave the interpreter empty as long as you give the filename the .cmd extension.

embedded_script.pngActions

Create two process actions, one pointing to wifi_enable.cmd, and one pointing to wifi_disable.cmd. You can access these embedded scripts by clicking the pull-down – you should see the embedded script(s) you created in step one – each prefixed with the @ symbol. The resulting dialog should look like this:

process_wifi_enable.png
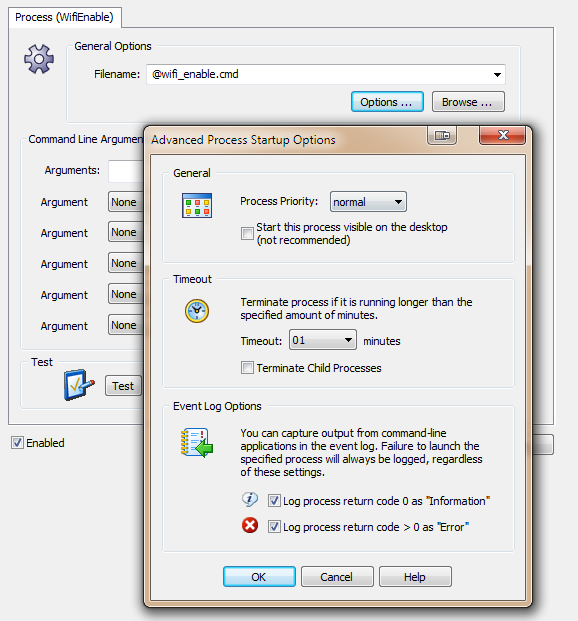
I recommend enabling both “Event Log Options”, as this will help with troubleshooting. Now we just need the event log filters, and we are all set.

Like I mentioned earlier, you can also reference any external process or .cmd file with the process action, if you’d rather not use embedded scripts.

Event Log Filters
Since we’ll need two filter, we’ll create a new event log package called “Toggle Wifi” by right-clicking the “Event Log Packages” container and selecting “Add Package”. Inside the package we can then add the two filters: One to trigger the “Wifi Enable” action when the NIC drivers logs its event indicating that the network cable was unplugged, and one that will trigger the “Wifi Disable” action when the NIC drivers logs that the network cable was plugged in. The filter will look similar to this, but note that the event source as well as event id will depend on the network card and driver.

filter_wifi_enable.png
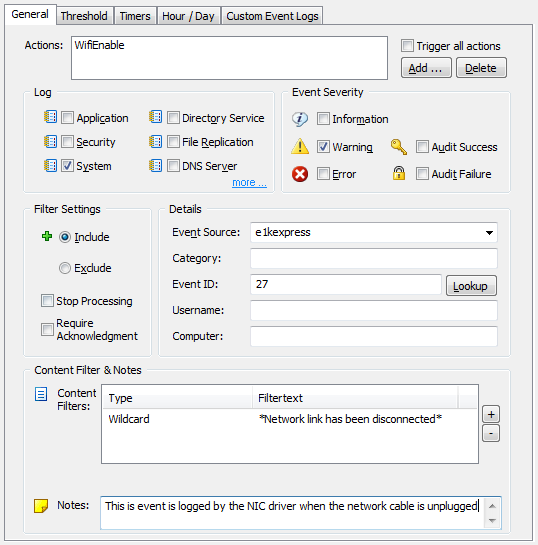
That’s pretty much it. If you enabled the event log options in the process action earlier, then you can see the output from the process action in the event log, as shown below:

event_action.png
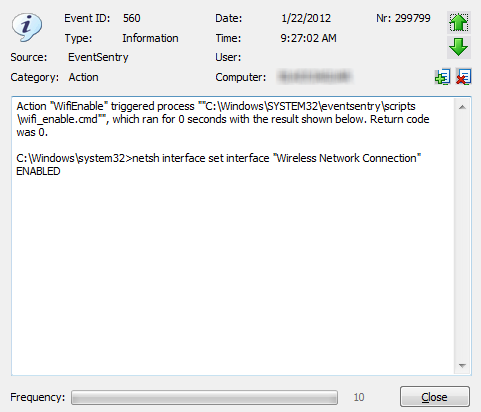
Here are some links to the official EventSentry documentation regarding the features used: