Perfect hardware for a TV-based dashboard

Dashboards are a great way to visualize large amounts of information in a concise matter. In IT we usually display various types of network data from a monitoring software, but dashboards are used in all sorts of environments. You can visualize stock data or just show a map of all trucks in a fleet with their current position.

If you work for a large company with a dedicated NOC then you’ll likely have an integrated setup with 4 or more TVs, connected to hardware specialized for dashboards or, at the very least, a powerful PC with multiple PCI cards.

But not everybody has the budget or the need for a NOC like AT&Ts, and one or two TVs can be sufficient for most networks – provided the dashboard is well-designed and customizable of course.

AT&T's NOC
AT&T NOC

Most dashboards require a fairly recent web browser (if you are unlucky even Adobe Flash), making some sort of a PC or Mac the preferred hardware to power that dashboard. Most IT departments have a plethora of old PCs sitting around, and it can be tempting to resurrect one of those boxes and give them a new life as a dashboard PC. After all, you’re “just” displaying a web page.

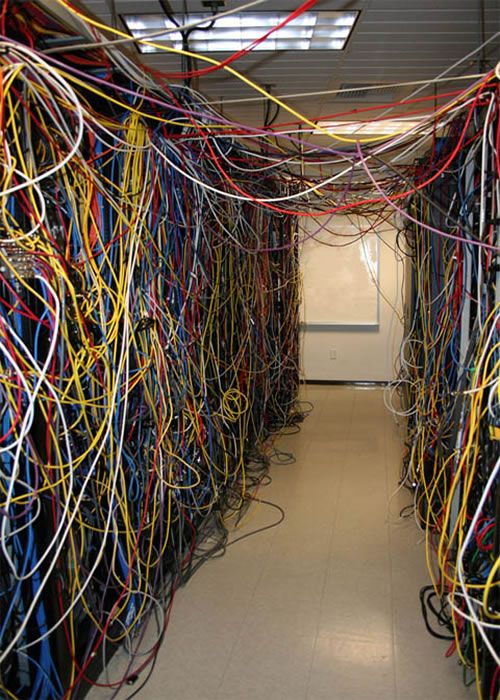
In reality, older hardware can a have hard time keeping up with modern browsers and the frenzy of Javascript operations that come with a busy dashboard. The dashboards often run well for some time (hours or days – depending on the hardware and the dashboard), but ultimately buckle under the load. The result is a dashboard that skips updates or breaks down altogether. Even if you do have a decent PC sitting around, it’s hardly a perfect solution since even small PCs take up a considerable amount of space, and cables can quickly get in the way. And I think we can all agree that the last thing we need more of are cables.

Low-cost integrated devices like the Raspberry Pi are tempting, but not perfect either. They’re not usually designed to be used with graphical interfaces, much less with memory and CPU hungry applications like web browsers displaying dashboards.

After trying everything from Raspberry Pi, old Mac Mini hardware and more, we finally found a solution for under $100 – which has now worked quite well for several months: The 1st generation Intel Compute Stick which you can get from online retailers like Amazon, NewEgg and others.

Intel Compute Stick
Intel Compute Stick

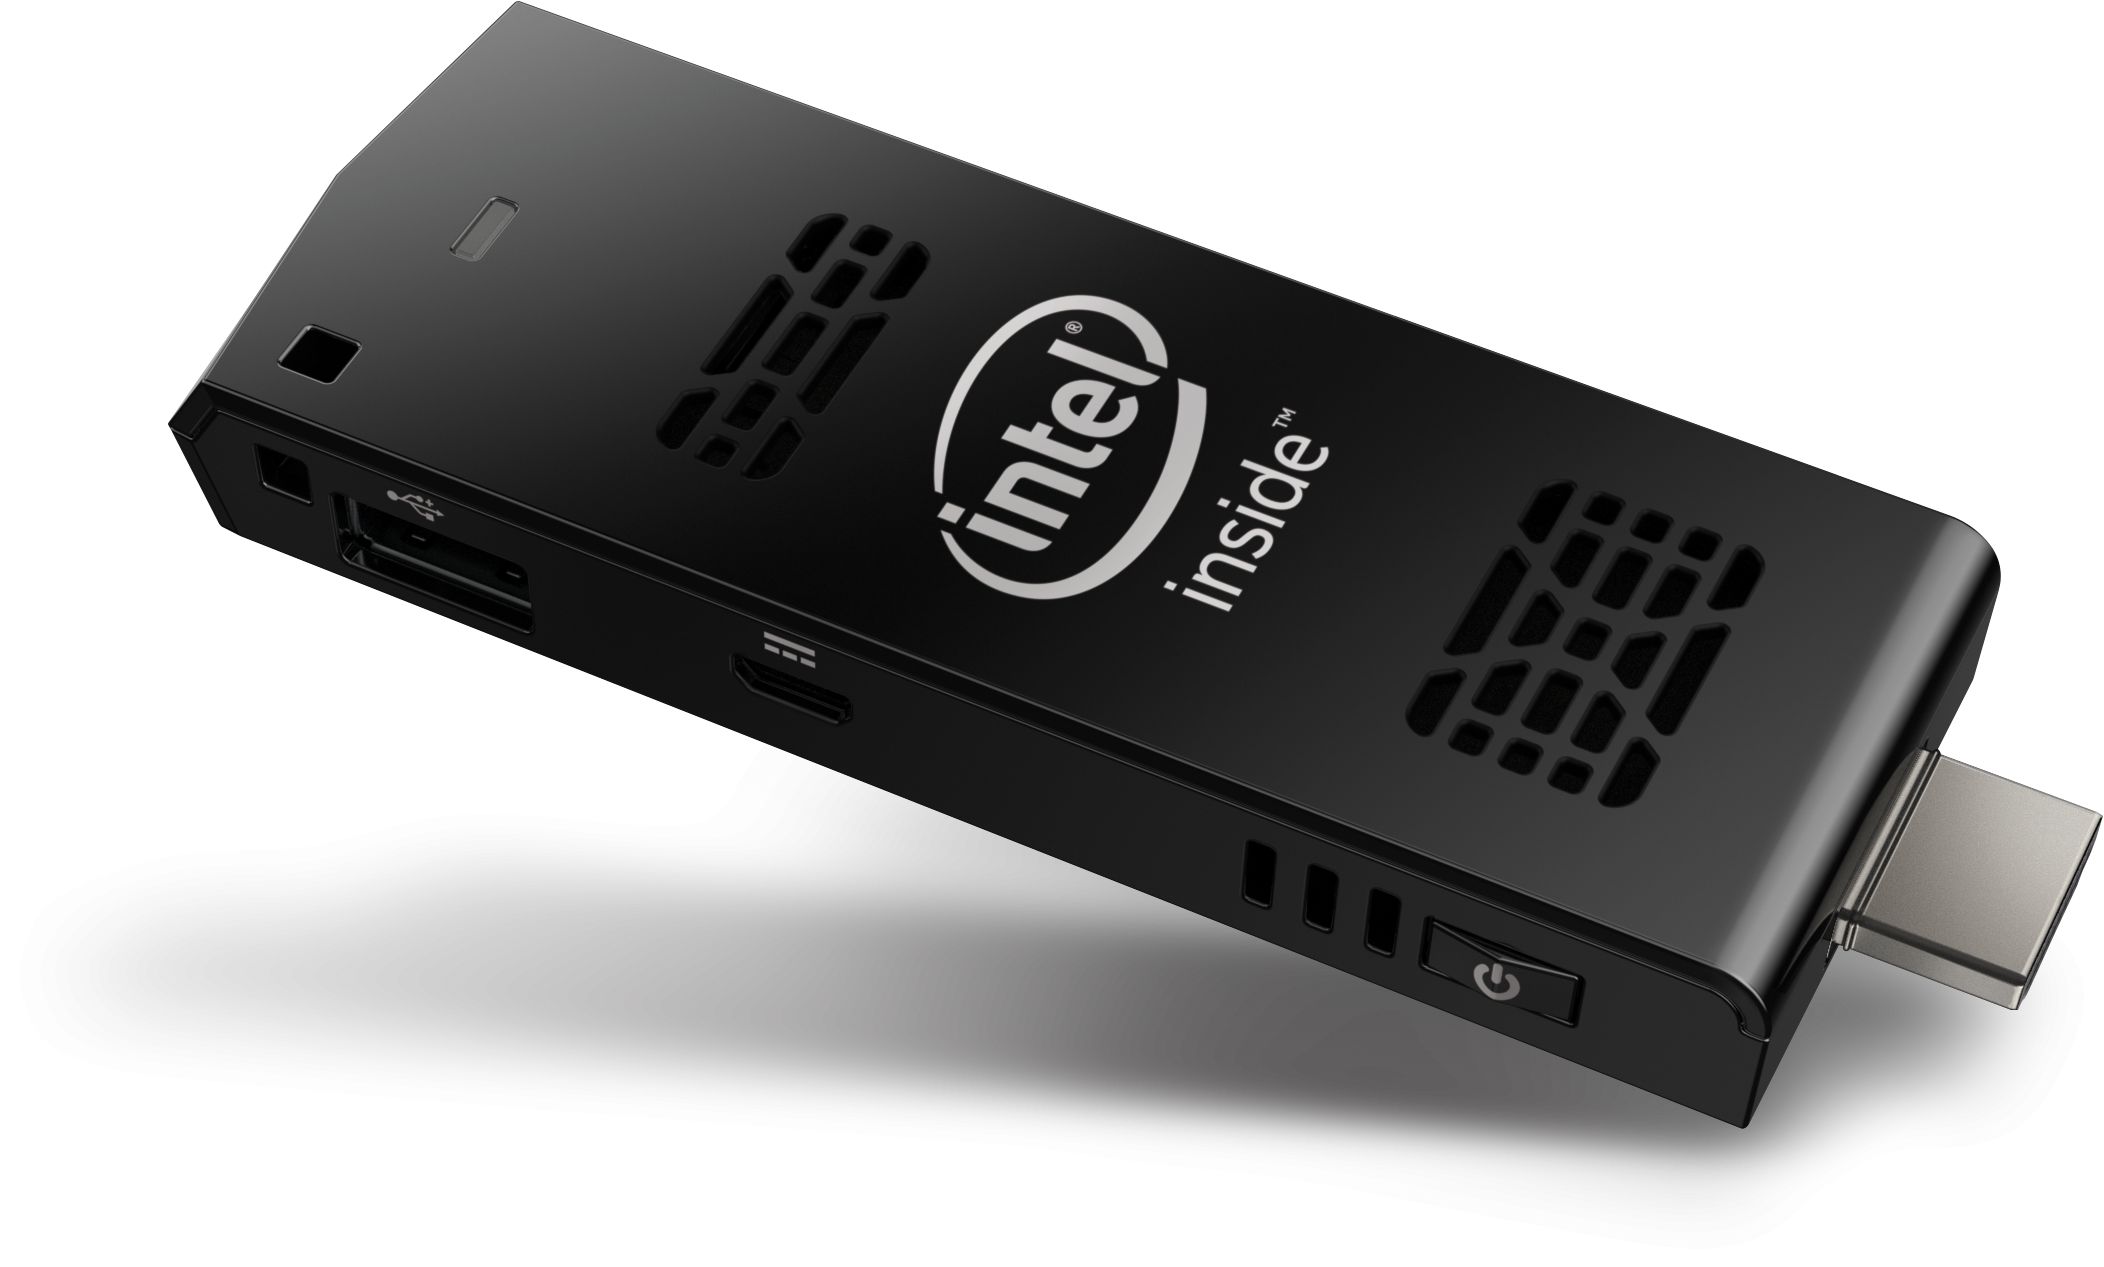
Even in its 1st generation (the one we tested) the Intel Compute Stick running Windows 10 Home performed surprisingly well. We’ve been running an EventSentry dashboard (which of course we’re hoping you are running as well) on it since February on Microsoft’s new Edge browser, and we’ve never had an issue.

The Intel Compute Stick features 2 Gb of RAM, is powered by a quad-core intel Atom processor and has 30 Gb of storage, of which more than half are available. This is of course not a machine you’ll want to render videos or play video games on, but plenty sufficient for a web browser from our experience. We were actually pleasantly surprised by how responsive the little device felt overall. Even though you cannot join a domain, you can still install the EventSentry agent on the machine to keep an eye on performance and other system metrics for example.

But there are of course some caveats, as is to be expected from a computer that costs less than $100 and is not much bigger than a USB memory stick. If you’re using Bluetooth and Wifi then you’ll only need to connect the power cord and the setup is clean. Since the stick also sports a single USB 2.0 port, we used a USB hub along with a USB-based Ethernet adapter to connect it to our LAN as well as connect a keyboard/mouse. USB 2.0 didn’t negatively affect performance in our limited use case scenario.

If you need more hardware, maybe because your dashboards are particularly taxing, then you can purchase a newer and faster model as well. The 2nd generation Intel Computer Sticks start around $149 and the high-end models include as much as 64Gb of disk space and 4Gb of RAM.

My first computer was a 80286 with 1Mb of RAM and a 20Mb hard drive, and it was about as big as two shoe boxes. It’s impressive to see a device this small perform that well. If you have the need to turn a TV into a full-blown desktop, then I’d definitely recommend the Intel Computer Stick(s)!

Additional Notes on EventSentry Update v3.2.1.30

Our latest patch for EventSentry v3.2 (v3.2.1.30) requires some additional information in addition to the release notes.

Heartbeat Monitoring (Agent Status)
By default, the EventSentry Heartbeat Monitor ensures that all remote agents are running by querying the status of the remote “EventSentry” service. While is an accurate way to ensure the remote agent is running, the Microsoft RPC mechanism isn’t very efficient when connecting to remote hosts across a slow (WAN) link, and concurrently checking the service status of 100+ hosts at the same time can on occasion also cause issues. In these situations, the heartbeat agent may not be able to monitor all hosts in the configured monitoring interval. Furthermore, querying the remote status of a service requires that the EventSentry Heartbeat Agent run under a domain account, otherwise the dreaded “Access Denied” error appears on the heartbeat status page in the web reports.

To address these issues for larger EventSentry deployments (500+ hosts) and deployments where the remote agents are connected through a slower WAN link, we have added the ability to query the remote agent status through the EventSentry database where the remote agents periodically check in. This check is enabled by default for new installations, but existing installations will need to make a database permission change in order to give the heartbeat agent permission to query the agent status. More information can be found here.

In the next release of EventSentry (v3.3), this functionality will be configurable, and the heartbeat agent will also be able to determine the current agent status by communicating directly with the collector service (when enabled) for even better accuracy. The Heartbeat Monitor will always attempt to revert back to the legacy method of checking the service status directly if it cannot obtain the status through other means.

Service Monitoring: Configuration Changes
EventSentry distinguishes between three types of service changes: Status changes (e.g. Running to Stopped), service configuration changes (e.g. changes to the startup type) and services being added or removed. Up until release 3.2.1.22, all status changes and service configuration changes were logged with the same event severity, which we didn’t think was very fitting since the status change of a service is very different to a change of the service itself. As such, starting with 3.2.1.30, only service status changes will be logged under the severity configured under “Monitor Service Status Changes” category. All other service changes will be logged under the severity configured under “Monitor Service Addition / Removal” category.

Management Console: Quicktools
The EventSentry QuickTools allow you to run an application/script against a server or workstation in your EventSentry configuration. EventSentry includes a few default QuickTools entries, such as “Reboot”, “Remote Desktop” and others. Starting with the latest release we added a new “Hide” option, which will not show the executed application on the desktop. This will be useful for integrating our upcoming VNC wrapper scripts (Blog article coming soon), which will allow you to install & launch a (Tiger)VNC client directly from the EventSentry management console.

EventSentry Light 3.2
Starting with this release, EventSentry Light v3.2 will also be available. We have good news for all EventSentry Light users: We have increased the number of full hosts you can remotely manage to 5, and also increased the number of network devices you can monitor to 5. As such you can now monitor up to 10 hosts with EventSentry Light completely for free.

Defeating Ransomware with EventSentry & Auditing (Part 3/3)

There seems to be a new variant of ransomware popping up somewhere every few months (Locky being the most recent one), with every new variation targeting more users / computers / networks and circumventing protections put in place by the defenders for their previous counterparts. The whole thing has turned into a cat and mouse game, with an increasing number of software companies and SysAdmins attempting to come up with effective countermeasures.

I’ve already proposed two ways to counteract ransomware on file servers with EventSentry in part 1 and part 2, both of which take a little bit of time to implement (although I’d argue less than it would take to restore all of your files from backups). The last part of the series, remediation, offers a way to remotely log off an infected user. In this post I’m proposing a third, and better, method with the following improvements:

In the first article we configured file integrity monitoring on a volume, and if the number of file modifications occurring during a certain time interval exceeded a preset threshold, the ransomware would be stopped in its tracks. In the seconds article we used bait (canary) files to accomplish the same thing.

In this third installment we’ll keep track of the number of file modifications made by a user to detect if an infection is underway. To effectively defeat ransomware, we have to be able to distinguish between legitimate user activity and an infection. To date we know this:

  • Users add/change/remove files, but the number of changes made by a user in a short amount of time (say 15 min) is generally small
  • Ransomware always runs in the context of a user, and as such an infection will usually come from one user (unless things go really awry and multiple users are infected). The approach here will work equally well, regardless of the number of infections.

Thus, to detect an infection, EventSentry will be counting the number of file modifications (event 4663) with its advanced threshold capabilities. If the threshold is exceeded, EventSentry will trigger an action of your choice (e.g. disable the user, remove a file share, stop the server service, …) to limit the damage of the ransomware.

Here is what you need:

  • Object Access / File System Auditing enabled
  • Auditing enabled on the files which are to be protected
  • EventSentry installed on the server which needs to be protected

This  KB article explains how to configure EventSentry and enable auditing (preferably through group policy) on one or more directories. I recommend referencing the KB article when you’re ready to configure everything. Pretty much everything in the KB article applies here, although we will make a small change to the threshold settings of the filter (last paragraph of section (4)).

Windows Folder Auditing

Once auditing is setup, Windows will log event 4663 for every write access which is performed by a user. An example event looks like this:

Windows Event 4663
Windows Event 4663

The default behavior of a filter threshold in EventSentry is to simply count every filter match towards the threshold. In our case, every 4663 event encountered would count towards the threshold. You can think of there being one bucket for all 4663 events, with the bucket being emptied whenever the threshold period expires, say every 5 minutes. If the bucket fills up we can trigger an alert.

This doesn’t work so well on a file server, where potentially hundreds of users are constantly modifying files. It would take some time to come up with a good baseline (how many file modifications are considered “normal”) that we could use as a threshold, and there would still be a chance for a false positive. For example, a lot of 4663 events could be generated during a busy day at the office, thus causing the threshold to reach its limit.

A better way is to assign each user their own “personal” threshold which we can then monitor. Think of it like each user having their own bucket. If a user writes to a file, EventSentry adds the 4663 event only to that user’s bucket. Subsequently, an alert is only triggered when a user’s bucket is full. Any insertion string of an event can be used to create a new bucket.

We can do this by utilizing the insertion string capabilities of the filter threshold feature. Setting this up is surprisingly easy – all we have to do is change the Threshold Options to “Event”, click the “Insertion Strings” button and select the correct insertion string. What is the correct insertion string? The short answer is #1.

The long answer lies in the “Event Message Browser”, which you can either find through the Tools – Utilities menu in the EventSentry Management Console or in the EventSentry SysAdmin Tools. Once in there, click on “Security”, then “Microsoft-Windows-Security-Auditing”, then 4663. You will see that the number next to the field identifying the calling user (“Security ID”) is %1.

Event 4663 Definition

Enough with the theory, here is what you need to implement it (assuming EventSentry is already installed on the servers hosting the file share(s)):

  1. Enable global auditing globally and audit the file share(s). See section 2 & 3 of KB 279.
  2. Determine what action you want to take when a ransomware infection has been detected. See either section 1 of KB 279 or “Dive! Stopping the Server Service” from the previous blog post.
  3. Create a package & filter looking for 4663 events. See section 4 of KB 279 and review the additional threshold settings below.

Customizing the threshold
Once you have the package & threshold filter for 4663 events in place, we need to modify the threshold settings as explained above. Edit the filter, click the threshold tab and make sure your filter looks like the one shown below:

Threshold Settings
Threshold Settings

The only variable setting is the actual threshold, since it depends on how fast the particular variant of ransomware would be modifying files. A couple of things to keep in mind:

  • The interval shouldn’t be too long, otherwise it will take too long before the infection is detected.
  • Make sure the actual event log filter is only looking at 4663 events, no other event ids.

With the above example, any user modifying any file (on a given server) more than 30 times in 3 minutes will trigger any action associated with the filter, e.g. shutting down the server service. Note that the action listed in the General tab will be triggered as soon as the threshold is met. If 30 4663 events for a single user are generated within 45 seconds, the action will be triggered after 45 seconds, it won’t wait 3 minutes.

Bonus – Disabling a user
One advantage of intercepting 4663 events is that we can extract information from them and pass them to commands. While shutting down the Server service is pretty much essential, there are a few other things you can do once you have data from the events, e.g. the username, available. You can now do things like:

  • Disabling the user
  • Removing the user from the share permissions
  • Revoking access to select folders for the user

There are a couple of caveats when (trying to) disable a user however:

  1. The user account (usually the computer account) under which the EventSentry service runs under (usually LocalSystem) needs to be part of the Account Operators group so that it has permission to disable a user
  2. Disabling a user is usually not enough though, since Windows won’t automatically disconnect the user or revoke access. As such, any ransom/crypto process already running will continue to run – even if the user has been disabled.

Disabling a user account from the command line is surprisingly simple (leave Powershell in the drawer). To disable the user john.doe, simply run this command:

net user john.doe /domain /active:no

Note that since “net user” doesn’t support a domain prefix (MYDOMAIN\john.doe won’t work), we need to make sure that we pass only the username (which is insertion string %2) and the /domain switch to ensure the user is disabled on the domain controller. Of course you would need to omit the /domain switch if the users connecting to the share are local users. The action itself would look like the screenshot below, where $STR2 will be substituted by EventSentry with the actual user listed in the event 4663:

Action to disable a user

That’s it, now just push the configuration and you should be much better prepared to take any ransomware attacks heading your users way.

Oh, and check those backups, would you?

3-2-1-Go! EventSentry 3.2.1 is out!

I am e-x-c-i-t-e-d to announce the availability of EventSentry v3.2 and tell you more about the new features and improvements. So, if you’re looking for a little bit more than the release notes then read on!

Collector
The biggest new feature in 3.2 is the collector, a new central component which enables a 3-tier architecture in EventSentry. Traditionally, the EventSentry agents have been communicating directly with email servers, databases and other services. While this usually worked well – and is still desirable in many setups – it does impose a limitation in some scenarios:

  • The SMTP server cannot be configured to allow relaying and/or accepting SMTP connections from remote clients
  • The central database cannot be configured to allow connections from remote clients
  • Agents need to communicate over an insecure medium like the Internet
  • Installing ODBC drivers is not an option
  • Remote agents communicate over unreliable network connections (e.g. satellite, laptops, …)

The collector addresses the above limitations by acting similar to a proxy between the remote agents and the service (e.g. database). In a nutshell, it provides the following benefits:

  • Agents only communicate with the collector over a single port
  • All traffic can be encrypted and compressed
  • Database connection details do not need to be stored on the agents anymore
  • All collected data is cached on the agents if and while the collector is unreachable

Whether you will need the collector or not will largely depend on your network setup. If all of your hosts are in the same data center and/or the same LAN, the collector may provide little benefit. If you are a MSP and monitoring remote sites and laptops however, then the collector is probably what you have been waiting for!

When upgrading (or installing from scratch), the post-installer configuration assistant will ask you whether you are interested in enabling the collector.

Collector Status
Collector Status in maintenance menu

If you are installing from scratch, then enabling the collector during the installation is all you need to do. When upgrading, an additional step is required – an action needs to be configured to use the collector. While the collector service is installed & started during the upgrade when selected, it will not enable any of the existing actions to use the collector. As such, if you want to route data for a specific action through the collector, that needs to be configured. Simply edit the action and click the “Use Collector” check box on the bottom left and push the configuration.

In version 3.2.1, the following actions can be routed through the collector:

  • Database
  • Email (SMTP)
  • Syslog
  • Text File

Since the collector, when enabled, is a critical component, we recommend monitoring the collector stats either through the collector status page (Maintenance -> Collector Status) or by adding the collector status tile to one of your dashboards.

There is one other advantage the collector can bring when routing emails through it:

  • Emails from multiple hosts can be grouped together (if the action polling interval is sufficiently high)
  • Action thresholds can now be applied centrally

Both features can help reduce the number of emails you receive from EventSentry, usually a popular thing to do!

Compliance Modules
EventSentry has always included the compliance tracking components which monitor and interpret Windows security events. Compliance tracking provides process, console, account management and other tracking reports. While popular and extremely useful, the compliance reports themselves don’t tell the user which particular compliance requirement they address.

Say Hello to the new compliance modules, which provide detailed, out-of-the-box reports for:

  • PCI-DSS
  • FISMA
  • HIPAA
  • GLBA
  • Sarbanes Oxley

Once a compliance module is enabled, it will install a number of reports that pertain to the specific compliance requirement that was enabled. Every report will be associated with a specific control (e.g. PCI 10.2.2) and allow you to setup a required review, job and more.

PCI Compliance Reports
Example of PCI compliance reports

(Network) Switch Mapping
Finding the port on a switch to which a server, workstation or network device is connected is often a time-consuming and annoying process for most SysAdmins. Starting with version 3.2, EventSentry tries to ease that pain by showing exactly to which switch – and port – a host is connected to. All you need to do is add the switch to the EventSentry configuration, make sure that it can be monitored via SNMP and that it provides the MAC to port mappings via SNMP (OID 1.3.6.1.2.1.17.4.3.1.2 – iso.identified-organization.dod.internet.mgmt.mib-2.bridge.dot1dTp.dot1dTpFdbTable.dot1dTpFdbEntry.dot1dTpFdbPort). This feature should work well with all mainstream managed switched, and we haven’t run into a switch yet where this feature wasn’t provided or did not work.

Server Room Cables
Server Room Cables

Once EventSentry pulls the MAC to Port mappings, you will be able to retrieve the collected information in two ways:

  • Through the Inventory – Switch page, which will show all monitored switches and connected devices
  • Through the Inventory – Host page. If the switch port can be detected, it will be displayed next to the IP address of the network card

Since switches only provide MAC addresses, EventSentry attempts to map MAC addresses to host names and IP addresses by analyzing the hardware inventory details as well as the ARP status table when available. As such, it is recommended to enable the ARP component of the network services if the results on your switch inventory page are incomplete.

EventSentry Switch Port Indicator

Web Reports Improvements
Starting with a visual overhaul of the interface, the web reports also received an internal overhaul to improve overall performance, especially when using multiple profiles. The performance trends page can now display multiple charts on a single page, and the host inventory page now shows the highest supported USB version on that host.

Managing multiple reports is easier now through the ability to bulk-edit reporting settings. Reports can now also be saved to a folder instead of being emailed.

Finally, the web reports are now also officially available in 6 additional languages: French, Spanish, Polish, Portuguese, Dutch and Italian. This brings the total number of supported languages in the web reports to 9!

Management Console Improvements
Improvements in the management console pertain mostly to remote update and computer management. Hosts can now be imported from a network scan, which is particularly useful when managing network devices which often don’t show up in Active Directory. The network scan is multi-threaded and can scan a class C subnet in a few seconds and even supports checking TCP ports for hosts which have ICMP disabled.

Remote update can now store the result of every activity in CSV file(s), and output from remote update can be toggled with the context menu to apply remote update actions to a sub-set of hosts easily.

Also new is the ability to export all event log filters to a CSV file allowing you to analyze the results in your favorite spreadsheet application to identify issues, duplicates etc.

That’s all folks. Time to get cracking on 3.3!

EventSentry SysAdmin Tools: New SNMP query utility “snmptool”

I’m excited to announce a new version of our free EventSentry SysAdmin Tools which, in addition to bug fixes and minor improvements, also includes a new command-line tool: snmptool. This brings the total number of utilities in the toolkit to thirty (30)!

Free SNMP tools for Windows® are not easy to find and often require you to memorize the various OIDs in order to test a remote host’s SNMP functionality, or to get useful information back.

Our free snmptool utility solves that problem by giving you a simple utility which downloads a variety of stats, depending on what the remote host provides via SNMP, and displays it to the user. For example, if you are querying a VMWare® ESXi™ host with the snmptool, it will – among other stats – enumerate all VMs configure on the host, whereas it will display switch port mappings when querying a switch.

The snmptool currently retrieves the following:

  • System Description string
  • Operating System
  • Uptime
  • Current CPU usage
  • Network interfaces (name, MAC address, IP if available)
  • Mounted disks
  • Running processes
  • Virtual Machines (ESXi™ only)
  • Switch port mappings

Running the utility is incredibly easy, simply specify the SNMP credentials and the remote host, and the utility will do the rest on its own:

C:\>snmptool /u public linuxserver
System Description: Linux openvas.netikus.local 4.32.22-573.7.1.el6.x86_128 #1 SMP Tue Sep 22 22:00:00 UTC 2019 x86_128
OS Info:            Linux 4.32.22-573.7.1.el6.x86_128 #1
Current Uptime:     3 years, 321 days, 3 hours and 52 minutes
CPU Usage:          0%
NICS:
=====
01: eth0 00-80-73-C3-57-BF (122.111.7.14)
DISKS:
======
01: DISK / (13892 Mb, 67% free)
02: DISK /dev/shm (938 Mb, 100% free)
03: DISK /boot (476 Mb, 75% free)
PROCESSES:
==========
01: init, PID=1
02: watchdog/1, PID=10
03: ext4-dio-unwrit, PID=1000
04: kauditd, PID=1035
05: migration/2, PID=11
06: flush-253:0, PID=1129
07: stopper/2, PID=12
08: kdmremove, PID=129
09: ksoftirqd/2, PID=13
10: kstriped, PID=130
….
125: kthrotld/3, PID=91
126: pciehpd, PID=92
127: kpsmoused, PID=94
128: usbhid_resumer, PID=95
129: deferwq, PID=96
130: jbd2/sda1-8, PID=999

The output is completely dynamic, if no processes are found (e.g. you are querying a switch) then that section will simply be omitted.

In addition to the brand new snmptool, version 2.2.0.1 of the EventSentry SysAdmin Tools includes the following other improvements:

Purgetemp
Added the new /a parameter which checks the target folder against a pattern for additional safety

Checkurl
Added support for authenticating against a login page, including login pages which redirect

I hope the new utility and other improvements will help make your job easier. Oh, and you can download the EventSentry SysAdmin Tools here.