Validating your IT environment, discovering browser extensions & more with EventSentry v4.2

This latest update to EventSentry improves your security posture with validation scripts, simplifies IT troubleshooting for both administrators and users, gives you visibility into installed browser extensions along with many other usability improvements in the web reports.

Validation Scripts

Proactively identifying (potentially) malicious behavior is the cornerstone of any security defense, and a key feature of log management / SIEM solutions. But many security violations are the direct consequence of incorrect or missing settings on endpoints.

Traditional log management solutions may show you when something is happening that shouldn’t be happening, yes. But wouldn’t it be better to assess key OS components and security settings on a regular basis, and identify known weaknesses?

Consider a motion-triggered camera that will let you know when somebody is snooping around your property at 3AM in the morning. That camera is extremely important, and the foundation of any serious property security system – without it, you wouldn’t even know what was going on!

But wouldn’t it be even better if somebody was inspecting your windows, fence and locks on a regular basis, to let you know if a door or window was unlocked, or an insecure lock was being used at one of the entrances? If your overall perimeter was more secure in the first place, there would be fewer potential intrusion attempts.

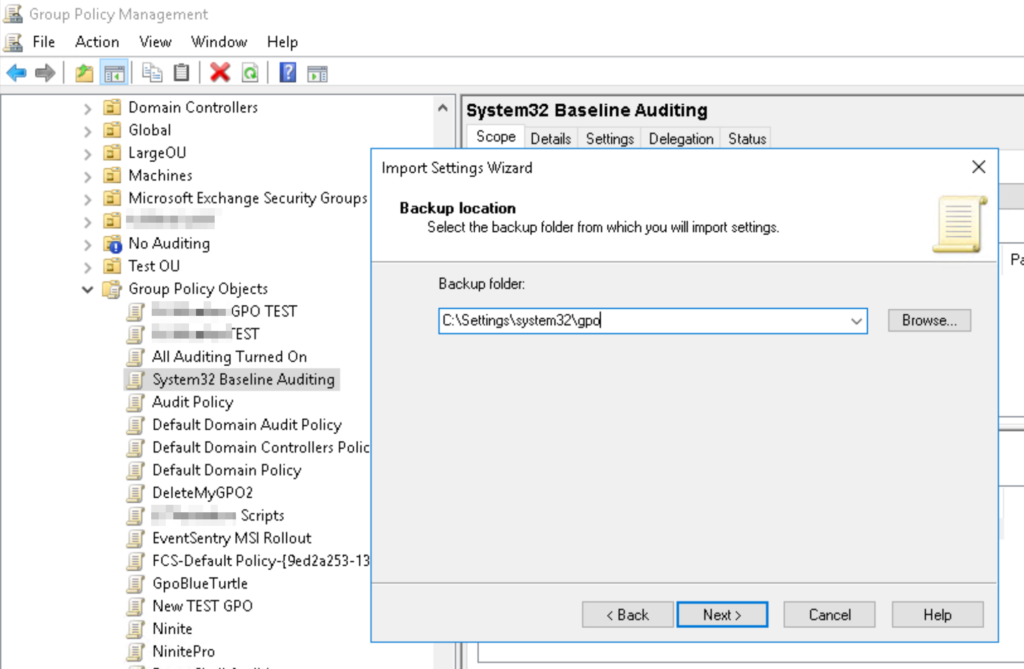
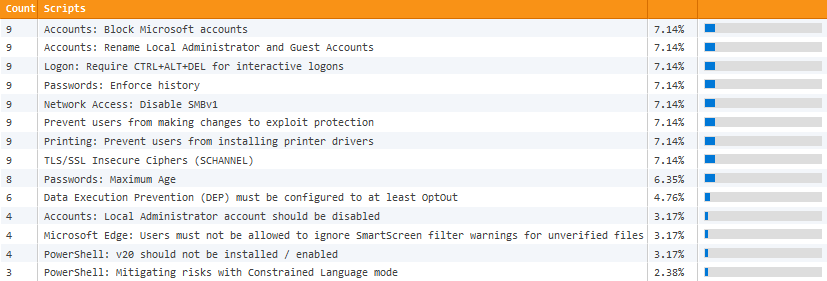
And that’s exactly what EventSentry’s 60+ validation scripts do. Our managed security & health checks continuously compare critical settings on your monitored hosts with our baseline, immediately indicating potential risks. These checks identify a wide variety of potential risks, such as:

  • A Windows server/workstation is not on the latest patch
  • Windows firewall is disabled
  • No A/V software installed
  • Insecure TLS protocols are enabled
  • Microsoft accounts aren’t blocked

EventSentry already includes a number of features that help detect security violations, rogue network devices, unauthorized software, suspicious network activity and more. But by utilizing the new validation scripts, you can fix many problems at the source – before they show symptoms.

The scripts are managed by NETIKUS.NET, updated regularly, and can be downloaded through the management console with a single click. Validation scripts are also tagged with keywords such as #server #compliance #stig-high-server to make sure that only relevant checks are assigned.


Which Browser Extensions are lurking in your network?

While web browser extensions can boost productivity and excite your end users, they also have inherent privacy and security risks. All major web browsers let users install as many extensions as they wish by default – without restrictions!

But do you actually know how many Firefox, Chrome or Edge extensions are installed on browsers across your IT infrastructure?

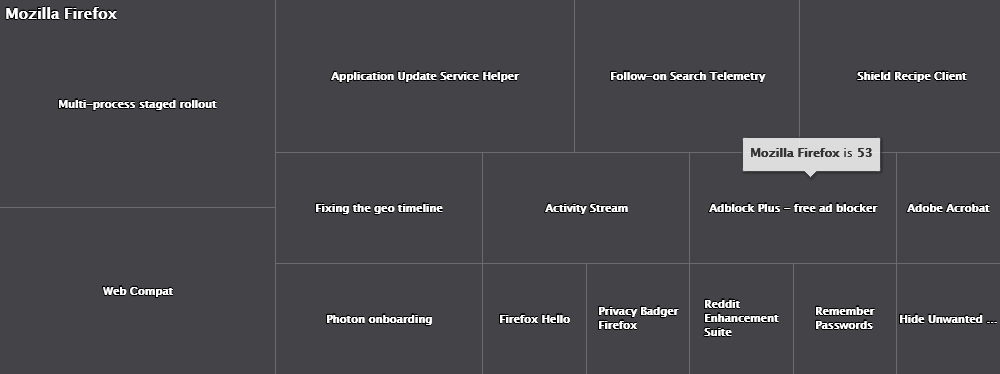
As an “extension” (no pun intended) of EventSentry’s software monitoring component, all browser extensions of Mozilla Firefox, Google Chrome and Microsoft Edge (Chromium-based) are inventoried with support for:

  • Alerts (extensions are installed/updated/uninstalled)
  • Searchable inventory

With this information at the fingertips, an initial discovery can be performed, a baseline set and reports or alerts can be received on a regular basis showing new extensions being installed.


Troubleshoot, Document & Support End Users with “EventSentray”

Supporting your end users has probably never been more challenging, considering they’re distributed all across the place and not conveniently squeezed into an office building anymore.

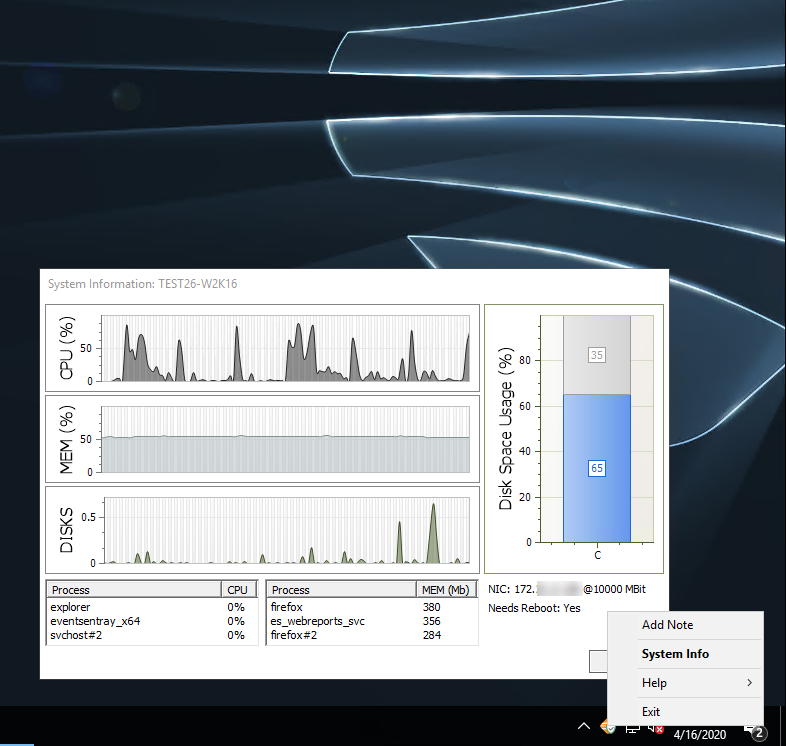
With the tray app “EventSentray”, your end users can submit support tickets to many common ticketing systems via email or HTTP requests right from the tray with a customizable link. And the best part? Support tickets created by the app not only include pertinent system information (current CPU %, host name, uptime, …) but can also include a current screenshot.

But we didn’t just design the tray app to give end users a way to submit support tickets right from their desktop, but also to help sysadmins.

Let’s be honest, when we log on to a server then it’s often because something isn’t working the way it should. Wouldn’t it be nice if one had easy access to information like:

  • CPU, Memory, Disk Usage & Utilization
  • Top 3 apps consuming CPU and memory
  • IP address, host name and connection speed
  • Whether the host needs a reboot

Simply double-clicking the EventSentry icon and the System Information dialog will show all of the above information – and more. Hovering over the charts will reveal additional hardware information as well.

And for those working in teams with shared responsibilities, right-clicking the tray app also lets you add notes (including a screenshot) for the monitored host. Those notes are then visible in the web reports and ensure that everyone on your team is on the same page when you make significant changes to a server or workstation. Documentation is key!


Tracking Administrator Activity

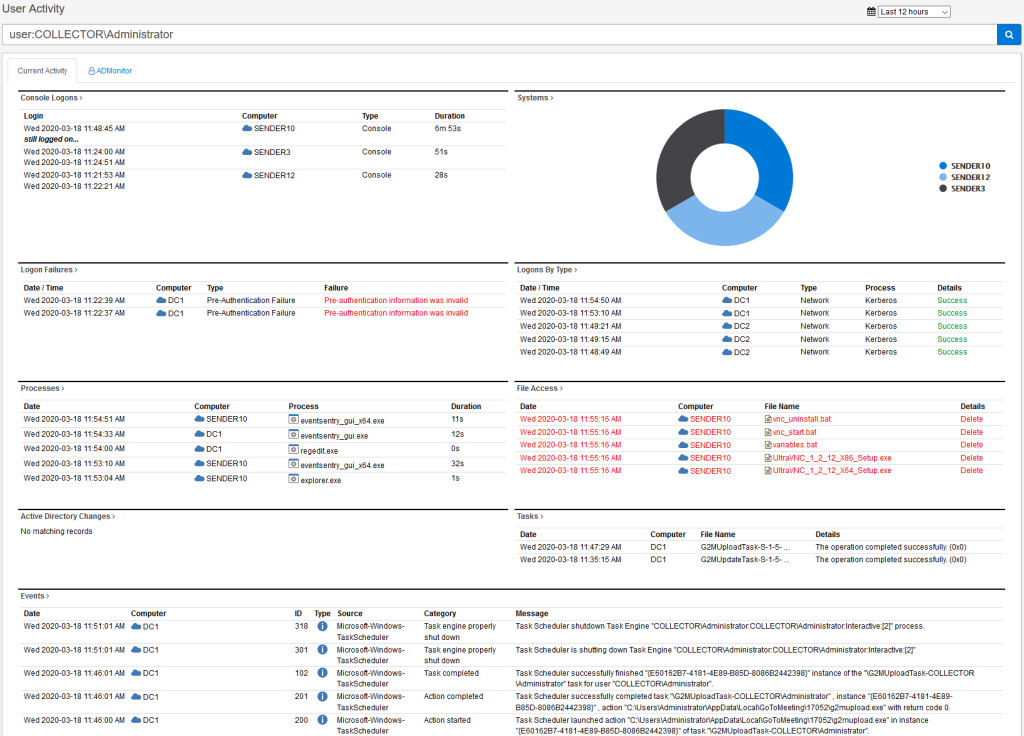
Many compliance frameworks require that you track activity by Administrators (e.g. Domain Admins) on your network. ADMonitor users now have the ability to filter all compliance reports (e.g. Logon Activity, Process Activity) to only show activity from users with domain admin privileges.

Dashboard Import / Export

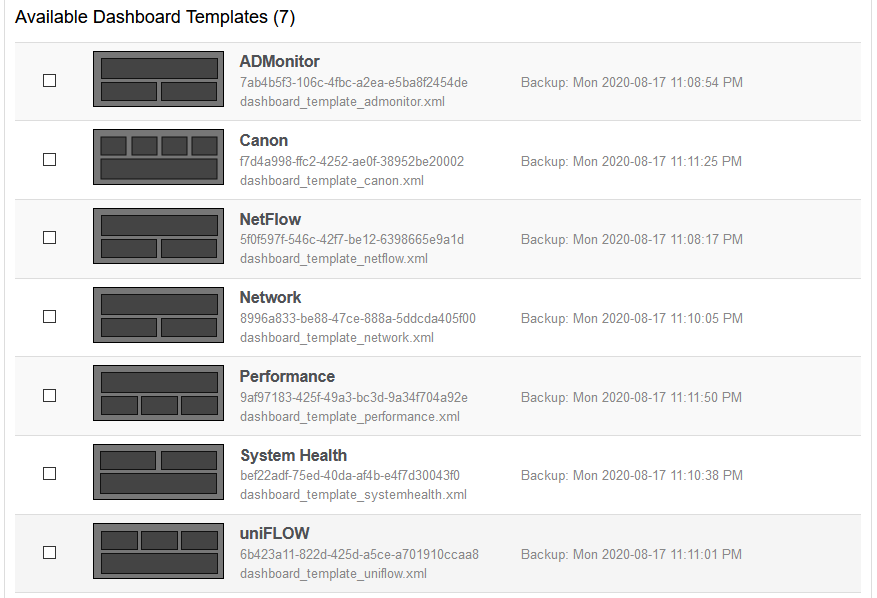
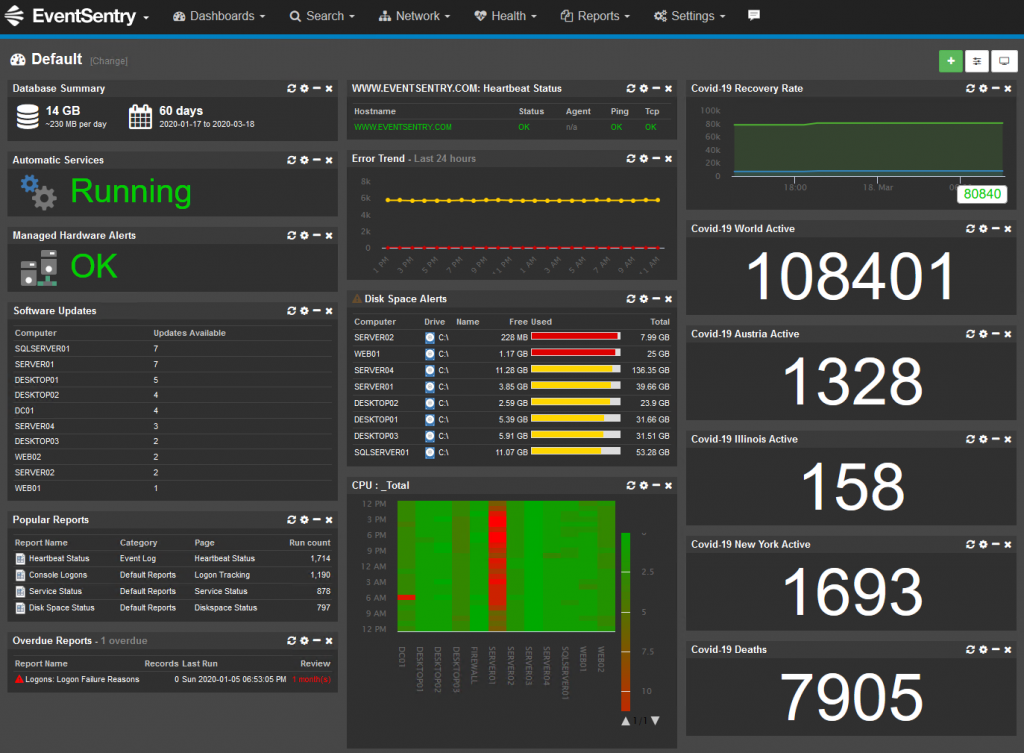
To make setting up dashboards easier and faster, EventSentry now ships with a number of dashboard templates that you can import. You can also export your own dashboards and import them on another EventSentry installation.

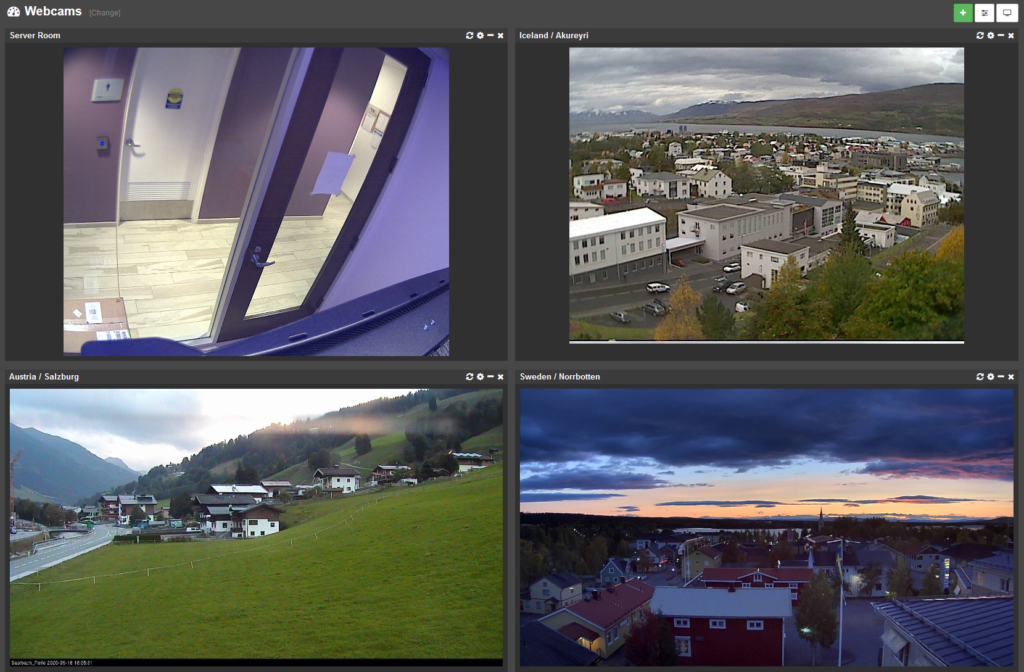
Webcam & Image Dashboard Tiles

The latest edition of the web reports includes a number of dashboard improvements, but the new image / webcam tile type definitely sticks out.

With the new “Image” tile you can point the web reports to a static image or stream to be displayed on any dashboard!

Covid-19: The importance of data & how it relates to Network Security

When China built an entire emergency hospital in a matter of days in Wuhan – a city about the size of NYC that most of us had never heard of – the world was watching with concern, but somehow still expected and hoped that the crisis would somehow remain contained to China, or at least Asia. People in Europe and the U.S. continued to go on about their busy lives, occasionally glancing at the headlines coming from China, where the government was taking drastic measures to curtail the spread.

It now seems beyond naive, even childish, to have thought that the virus wouldn’t spread to other parts of the planet. The world we live in today, where between 8,000 and 20,000 planes fly across the sky every single day, is the perfect conductor for a virus with an incubation period as high as two weeks. This gave the virus, which had already started making its way through Wuhan and China back in December, more than enough time to slowly travel to other countries on planes and ships.

Flights coming to and from Europe back in 2010

Fast forward two months, and what is currently taking place in many parts of the world is something we would have only expected from a fatalistic science fiction novel or cheesy Hollywood movie: a stock market crash on par with that of October 1929, a large percentage of planes grounded either due to government mandates or lack of business, borders shut, and almost 200 million people – from democratic countries nonetheless – under a curfew that will likely last weeks. Empty shelves in grocery stores, abandoned playgrounds and formerly busy streets are now empty resulting in thousands of closed restaurants and stores, some of them possibly forever.

The picturesque town of Heiligenblut in Austria, currently under quarantine in March 2020

The current global crisis feels like a medley of 9/11, the 2008 recession and then some. Yet it’s not due to a war or natural disaster but because of the respiratory disease that goes by the catchy name of “Covid19.” This disease is caused by the SARS-CoV-2 virus that was at some point transmitted to humans from animals, as far as we know from either bats, pangolins or a combination of the two (whatever happened to eating tofu?).

Image Credits: Scientific Animations under the CC BY-SA 4.0 license

What does all this have to do with monitoring and network security?

But one country in Asia, located much closer to China than Italy and with a similar population density, has managed to avoid the disaster that is currently ravaging through Europe. That country is South Korea, where the number of new cases has slowed significantly since its peak at the end of February, without imposing curfews. South Korea has accomplished this with rigorous testing and isolation, including tracing contacts of infected people and quarantining them. Singapore, Taiwan and Hong Kong were similarly successful.

How did they do this? Data. Since a large percentage of infected people show little to no symptoms – particularly difficult to distinguish during flu season – the only way to suppress the spread of the virus is to know who has the virus in the first place. And then, once identified, immediately isolate the affected individuals and people who had contact with them. If you wait until sick people show up at the hospital, then you are already way behind the curve. For every person that shows up at the hospital, you likely have twenty more walking around infecting others.

Here at EventSentry we’re neither virologist nor pandemic experts. But there are noticeable similarities between this outbreak and a computer virus/malware infection. The purpose of monitoring after all is to be aware of what is happening on the network so that organizations can take action to stem the infection. You can only fight what you can see and measure.

Activity of a single user at a glance

The equivalent of Covid19 testing in IT is monitoring. Monitoring only part of your infrastructure isn’t enough – just like testing only 1% of the population isn’t sufficient. Yes, the infected hosts will eventually reach the monitored ones, but at that point the majority of your infrastructure may already have been compromised.

Many computer viruses, when infecting a computer (host), first attempt to silently infect other hosts before they do damage in one way or another. SARS-CoV-2 has similar properties with an usually long incubation period. During that time, the host is unaware that he or she is carrying the virus, potentially infecting others through direct or indirect (e.g. surfaces like door knobs) transmission.

The SARS-CoV-2 virus is quite sneaky and would likely do well in the popular “Plague” game, where the player creates a virus with the goal of infecting and ultimately killing the entire world population. One of the most important properties of a virus in the game is that it’s highly contagious but not too deadly – otherwise it would kill all of its hosts before it can spread. 

Thankfully, SARS-CoV-2 is neither as deadly nor contagious enough to accomplish this, yet it’s second only to the Spanish Flu that killed between 20-40 million people almost 100 years ago. See this article for more information on how Covid19 compares to past outbreaks.

Victims of the Spanish Flu in Kansas, 1918

Finding patient zero – the first person to have contracted a virus, is similar to finding the source of a malware outbreak. In medicine it may provide important clues on how to come up with a cure, whereas in IT security it can provide important information on how an attacker penetrated a network. Monitoring software like EventSentry doesn’t just detect problems in real time, it also collects troves of important logs and other system data that can be of incredible value after a network has been compromised. China is still desperately trying to find and confirm patient zero, who may have been infected as early as October 2019.

On our never-ending quest to slash cost in order to maximize profits, manufacturing of both medicine and medical supplies has been outsourced to China, India and other countries. While there is nothing wrong with saving costs and manufacturing items where it costs less, it’s clear that there is a benefit of manufacturing certain products in the country where they are being used.

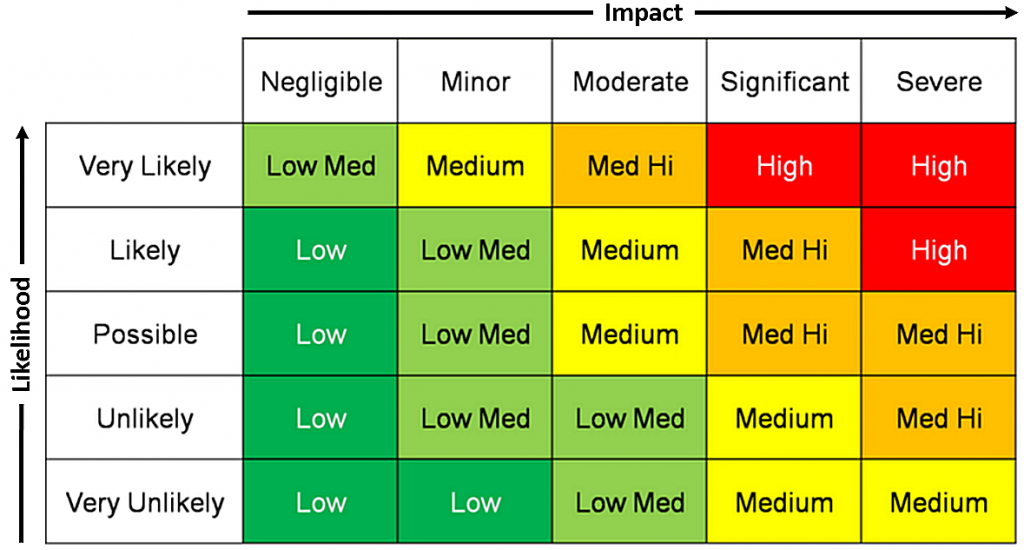
Similarly, cost savings in IT budgets that compromise the overall security of the IT infrastructure and with it the company itself, rarely pay off in the long turn. As you can see from the matrix below, even a very unlikely circumstance that will have a significant impact on a business has a medium risk and should be addressed.

Risk Matrix

But in the midst of the all the chaos and uncertainty, there also upsides. The severe reduction of air traffic and travel give our planet a long overdue breather, as satellite images in Italy have shown. It’s also noteworthy that air pollution (and smoking) make the lungs much more susceptible to respiratory diseases like Covid-19.

We need to remind ourselves that we’re not robots and machines but mammals that live on a planet shared with nature – animals – their viruses included. As we humans continue to encroach on their habitats and land, the risk of another deadly virus spreading doesn’t go away. Watch this short 5-year old video about bats and the viruses they carry.

For me it’s still difficult to comprehend that the current pandemic is connected to consuming bats, pangolins (most of which are endangered) and other wildlife. Some risks are just not worth taking, and it would be prudent of the Chinese government to permanently ban this obviously dangerous practice.

Illicit Pangolin trade in Myanmar – by Dan BennettFlickr: DSC_4970, CC BY 2.0, Link

In the meantime people will need to continue to isolate, self-quarantine or shelter in place until the number of new cases continues to decline and toilet paper is available again.

To keep an eye on Covid-19 cases in your country and/or state with EventSentry (v4.1), you can follow the instructions in this HowTo and view Covid-19 stats in any dashboard or performance chart.

As an IT professional I encourage you to stay alert, as many bad actors are exploiting the current chaos with phishing campaigns for a variety of nefarious reasons. We highly encourage you to consider monitoring workstations and laptops with EventSentry to ensure you have complete visibility and prevent a bad situation from becoming worse, we are offering discounts on a case-by case basis. In addition to monitoring all the things you’re familiar with from your servers, EventSentry monitors laptop batteries, Bitlocker status, outdated software and more.

Thank you for being an EventSentry customer, stay safe and positive during this difficult time.

EventSentry v4.1

EventSentry v4.1 builds on v4.0 released earlier this year and offers a lot of exciting new & improved features that enhance a variety of different monitoring scenarios. In this release we improved:

  • ADMonitor
  • Laptop / Mobile Monitoring
  • Performance Monitoring
  • NetFlow Security
  • MSP Support
  • Security Features
  • Web Reporting


ADMonitor

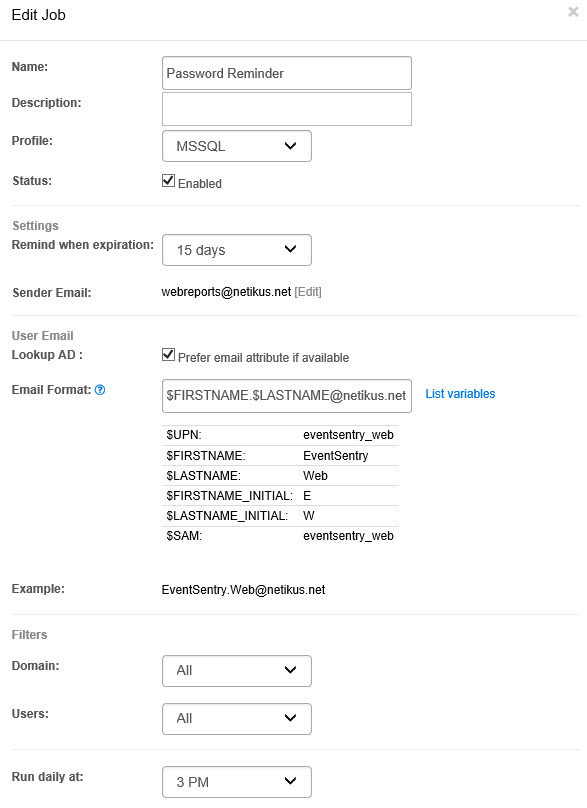
Expiring passwords can often be an issue in larger networks, especially for mobile users whose passwords expire while they are out of the office. The new “Password Reminder” feature in ADMonitor alleviates this issue by giving you the ability to automatically send out password expiration reminders to your users before the password expires. The only requirement is that the ‘mail’ attribute is set for your users, or that it’s possible to dynamically determine the end user’s email address from one or more of its AD properties (e.g. first name, last name).

ADMonitor Password Reminder Email Configuration

We also added new ADMonitor-related tiles that provide an overview of recent AD changes.

Active Directory Statistics


Laptop / Mobile Monitoring

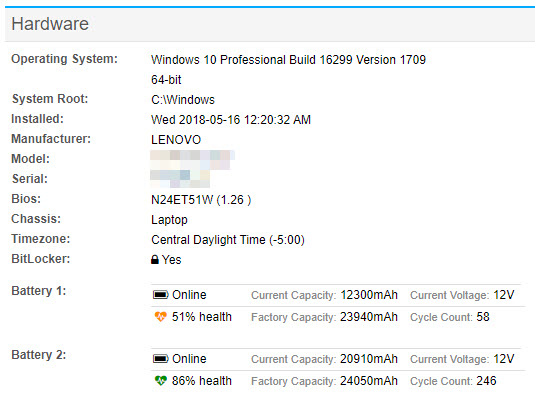
With an increasing number of employees working remotely, ensuring that laptops are properly monitored and secure should remain a priority for any company that manages laptops. Starting with v4.1, EventSentry detects the BitLocker status of any host, allowing you to run reports to identify all laptops that pose a security risk due to their hard drive not being encrypted.

Battery Health Monitoring

We also improved operational monitoring by tracking the health of laptop batteries; EventSentry can now tell you how healthy a laptop battery is based on the current capacity and the charge cycle count.


Performance Monitoring

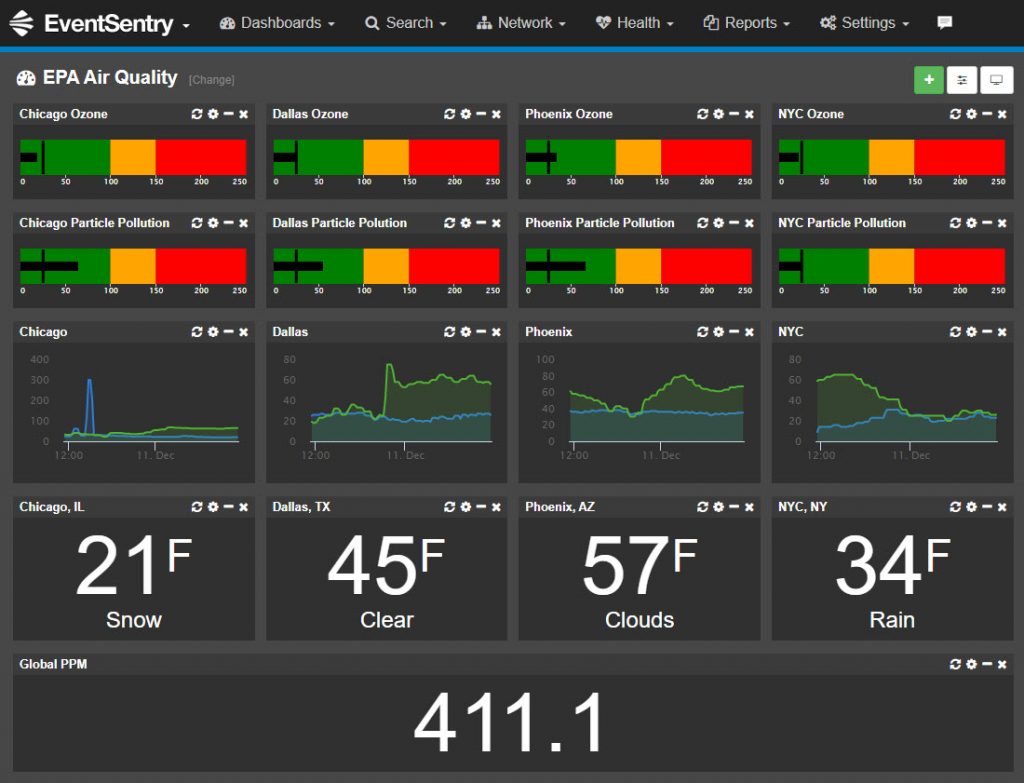
Up until now performance data could “only” be retrieved from Windows performance counters and SNMP-based counters, but obtaining data from other sources like web pages or utilities was not supported. This limitation is a thing of the past as you can now use the output of any executable or script as a data source – with practically unlimited possibilities. For example, numerical data from system tools, web pages and log files can now be visualized and alerted upon – all with the same familiar interface. An example of this new functionality can be seen on our live demo, where we’re displaying air pollution stats from 4 major cities in the US along with the global PPM (courtesy of the EPA).


NetFlow Security

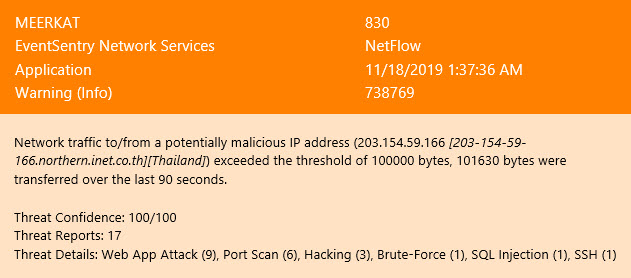
EventSentry’s NetFlow implementation already includes two important security-related features: The ability to detect port scans and identifying traffic going to / coming from potentially malicious IP addresses (with support for AbuseIPDb).

One potential short-coming with the malicious IP detection is that any of your public-facing IP addresses will – sooner or later – be contacted by a remote IP address deemed malicious. These alerts often result in unwanted and unnecessary noise, especially if the port / service that the remote IP address tried to contact is blocked anyways.

To make these alerts more actionable, NetFlow v4.1 keeps track of the amount of traffic sent/received from a malicious IP, resulting in intelligent notifications that are only triggered if the amount of traffic exceeds a (configurable) limit. This means that you will only get an alert if a meaningful amount of data (e.g. 1Mb) was transferred to or from a malicious IP – for example if a APT is active on your network. Once identified, you can either get an alert and/or take corrective action by blocking the offending IP address.


MSP Support

EventSentry’s architecture already supports MSP-style scenarios well: Granular permissions and multi-tenant support in the web reports allow for multiple clients, and remote agents running on a customer network can securely transmit all data encrypted over the Internet to the central EventSentry collector.

Starting with V4.1, both the heartbeat and network services components also integrate with the collector and can transmit all collected data from the customer’s network directly to the collector – instead of requiring a direct database connection.


Security

Helping you keep your network as secure as Fort Knox and assisting you with your compliance requirements remains a top priority for EventSentry.

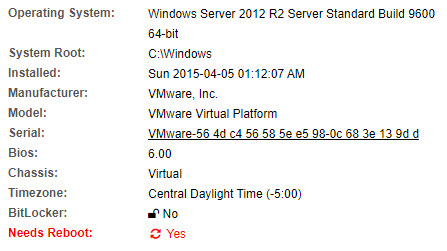
Do you know how many servers and workstations on your network require a reboot to finish installing Windows updates or software? EventSentry now detects pending reboots as part of its inventory functionality – simply schedule a report on this new flag and you’ll never forget to reboot critical systems again.

BitLocker and “Needs Reboot” indicators

BitLocker detection mentioned earlier also helps you secure your mobile workforce by quickly identifying laptops that do not use full disk encryption.

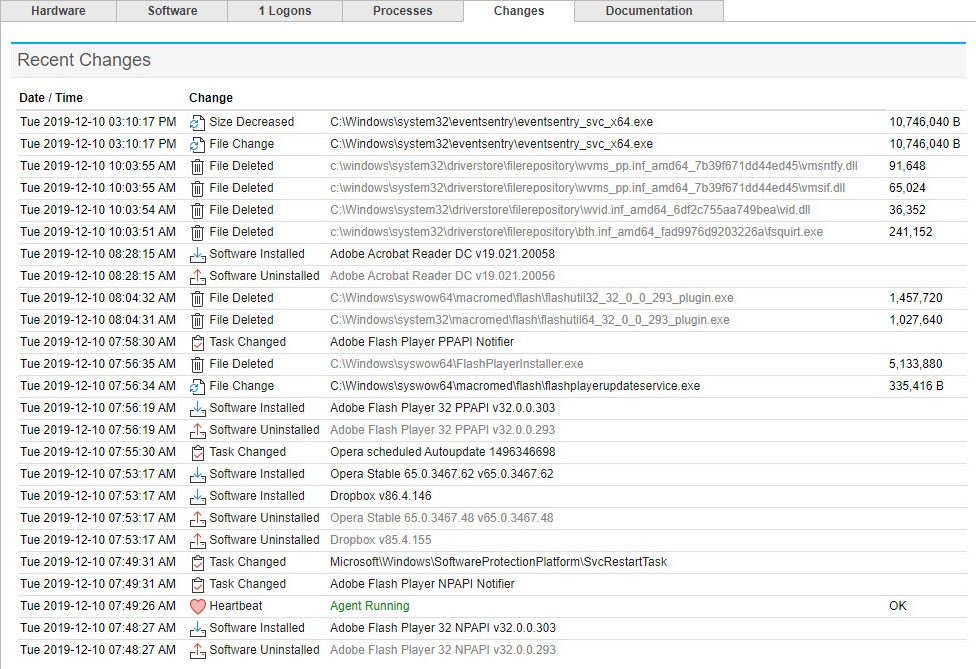
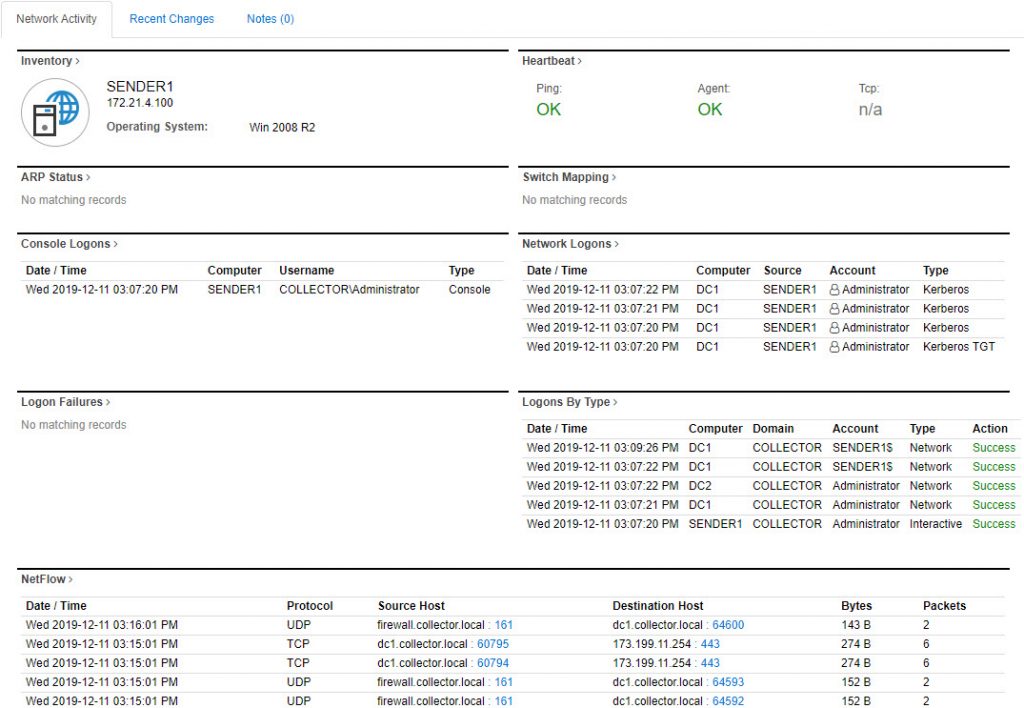
To aid troubleshooting and forensic analysis we added a “Changes” view that shows all permanent changes that occurred on a selected host – for example services being added/removed, critical system files, software installations and more. This is available on the Host Inventory page as well as the IP Activity page.

Changes made to a monitor host at-a-glance

For users who need to be compliant with CJIS we also added CJIS reports to list of compliance reports.


Web Reports

Besides a UI refresh and easier access to event log data, Syslog messages can now also be acknowledged – just like event log records.

Since accumulating too much data is a common issue for our users, we improved the Database Summary dashboard tile which actively monitors the database size and detects failed purge jobs.

The IP Activity page has been improved and now offers more actionable information about IP and host activity.

Finally, for those concerned about Java(c)’s licensing, EventSentry now utilizes the OpenJDK.

We hope you find this additions useful, as always please don’t hesitate to send us feedback. I also encourage you to check out our system32.eventsentry.com site which has a ton of information about Windows events and more. It’s under constant development and tells you how events are related, whether you should monitor them, which audit settings are associated with the event and much more.

Happy Monitoring!

RDProtector: Automatically blocking malicious IPs from RDP with EventSentry

RDProtector: Automatically blocking malicious IPs from RDP with EventSentry

The recently discovered BlueKeep RDP vulnerability reminds us yet again (as if we needed to be reminded) that monitoring RDP is not a luxury but an absolute necessity.

Many organizations still expose RDP ports to the Internet, making it a prime target for attacks. But even when RDP is only available internally it can still pose a threat – especially for large networks.

So let’s start this off with some very basic best practices:

  • Make sure that RDP access is blocked from the Internet (e.g. only accessible via VPN)
  • RDP should be disabled on hosts where it’s not needed
  • All RDP access should be monitored (see below)

In this post you will see how EventSentry (and EventSentry Light) can be configured to automatically block remote hosts that have failed to log on via RDP after a certain number of times. Utilizing EventSentry offers a number of benefits over other approaches:

  1. It works with any version of Windows, from Windows 2008 to Windows 2019
  2. It works regardless of account lockout policies
  3. The threshold and time period are fully configurable
  4. The default action (block Windows firewall) can be substituted and/or supplemented with other actions

Before we delve into the nitty gritty details I need to level the playing field and explain why blocking remote RDP connection attempts is not as simple as linking event id 4625 with type 10 (failed RDP logon attempt) with an action. See, in the good old days security events logged by Windows mostly meant what they said. Failed logon events logged by Windows always included the correct logon type – all the way back to Windows Server 2003 (back then it was event 529). Having an event that included both the username, IP address and logon type made it straightforward to setup a rule:

If # of failed logons with type 10 of a [user] and/or from [IP address] > [threshold] then do [ABC].

All that changed with the introduction of NLA (Network Level Authentication), where the initial authentication of a RDP session is offloaded to another Windows subsystem, resulting in key information being lost in translation inside Windows.

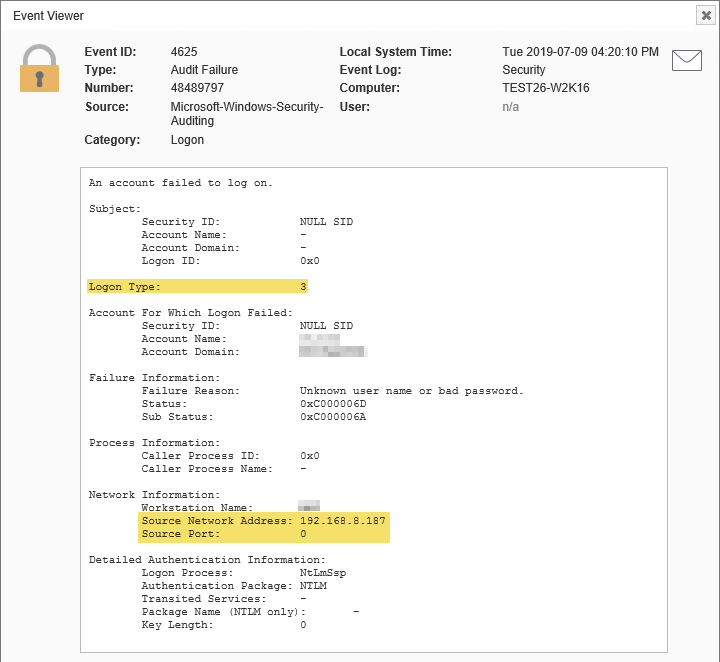
The result is that starting with Windows 2008 and NLA enabled, event id 4625 always classify failed RDP logon attempts as logon type 3 instead of logon type 10. As a reminder, logon type indicates a network logon – not a RDP logon. It’s consequently impossible to use 4625 events as the sole indicator for a failed RDP logon.

Security Event 4625 with Logon Type 3 (network logon)

How do you know if NLA is enabled? It’s usually pretty simple: If you are prompted for credentials when initiating a RDP connection before you see the Windows logon screen then NLA is enabled.

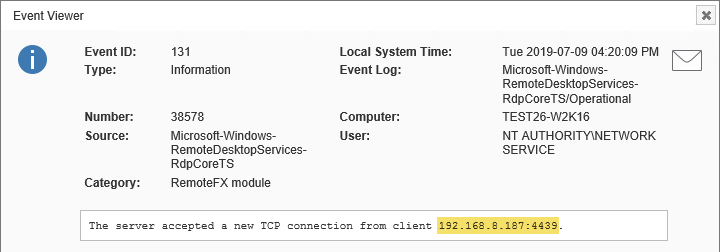
In an effort to better audit RDP connectivity events, Windows 2008 and later include a new event log, the Microsoft-Windows-RemoteDesktopServices-RdpCoreTS/Operational log, which logs some RDP activity. I say some because it cannot be used to solely detect failed RDP logins. While we have been able to consistently generate events when a remote client connects (event id 131), we have been unable to consistently generate the more important event id 140, which indicates a failed login (which could be used in place of the 4625 event to trigger an action).

Microsoft-Windows-RemoteDesktopServices-RdpCoreTS event 131

So what are we to do? On the one hand we have an event telling us that a RDP connection has been initiated (although not fully logged on yet), and on the other hand we have a failed logon event that is virtually identical to hundreds or thousands of other failed logon events.

Thankfully there is an easy solution with EventSentry’s filter chaining feature, which allows us to correlate events from the security event log with the new RdpCoreTS event log. This allows us to correlate audit failure event 4625 from the Security event log with information event 131 that is logged in the Microsoft-Windows-RemoteDesktopServices-RdpCoreTS/Operational event log

Filter chaining is activated on the package level, and can trigger an action (e.g. email, process, …) when all filters in a package match events in a certain time period. To make sure that the correct types of events are chained (correlated) together, insertion strings sharing the same data can be specified. And since both events include the IP address of the remote host connecting, they can be linked (chained) together if they occur within a certain time frame (e.g. 10 seconds).

When linking events via insertion strings it’s important that the strings match exactly, any deviation will break the chain. This turns out to be a potential issue since event id 131 doesn’t just log the remote IP address but also the remote source port in a single string (e.g. 192.168.1.1:33544). Event 4625 also logs the remote IP and source port, but in different fields.

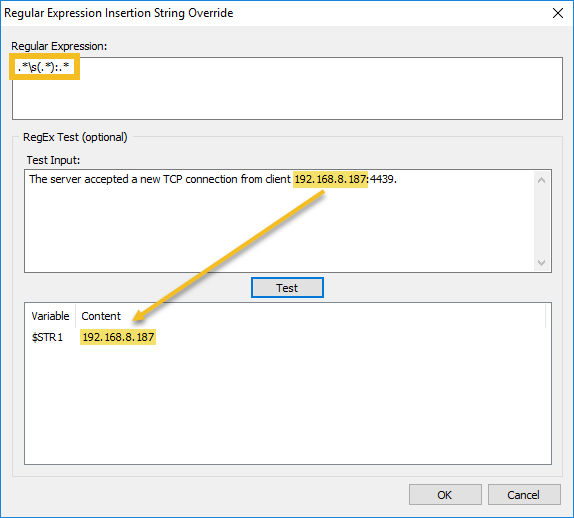
To address this, EventSentry includes a feature that can override existing insertion strings (or create new ones if none already exist) which comes in handy in this scenario. In the case of the event 131 we can use a RegEx pattern to simply remove the remote port from the string so that we only end up with the IP address – as the only insertion string.

Transforming or creating insertion strings (meta data) using RegEx expressions

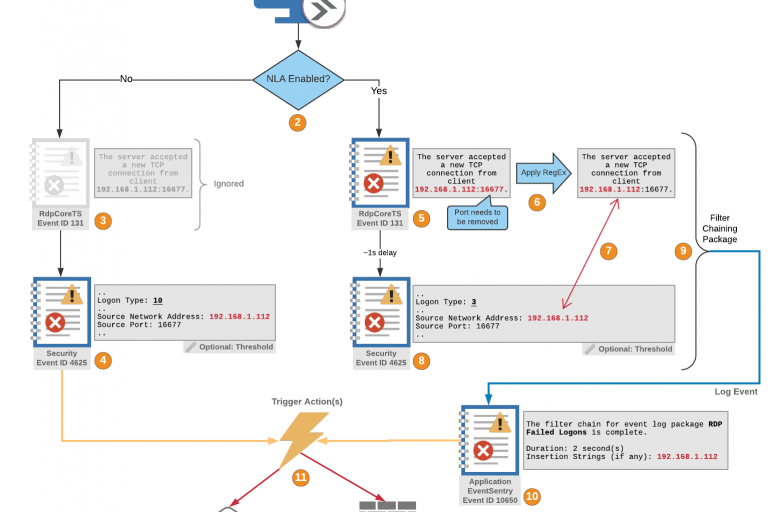
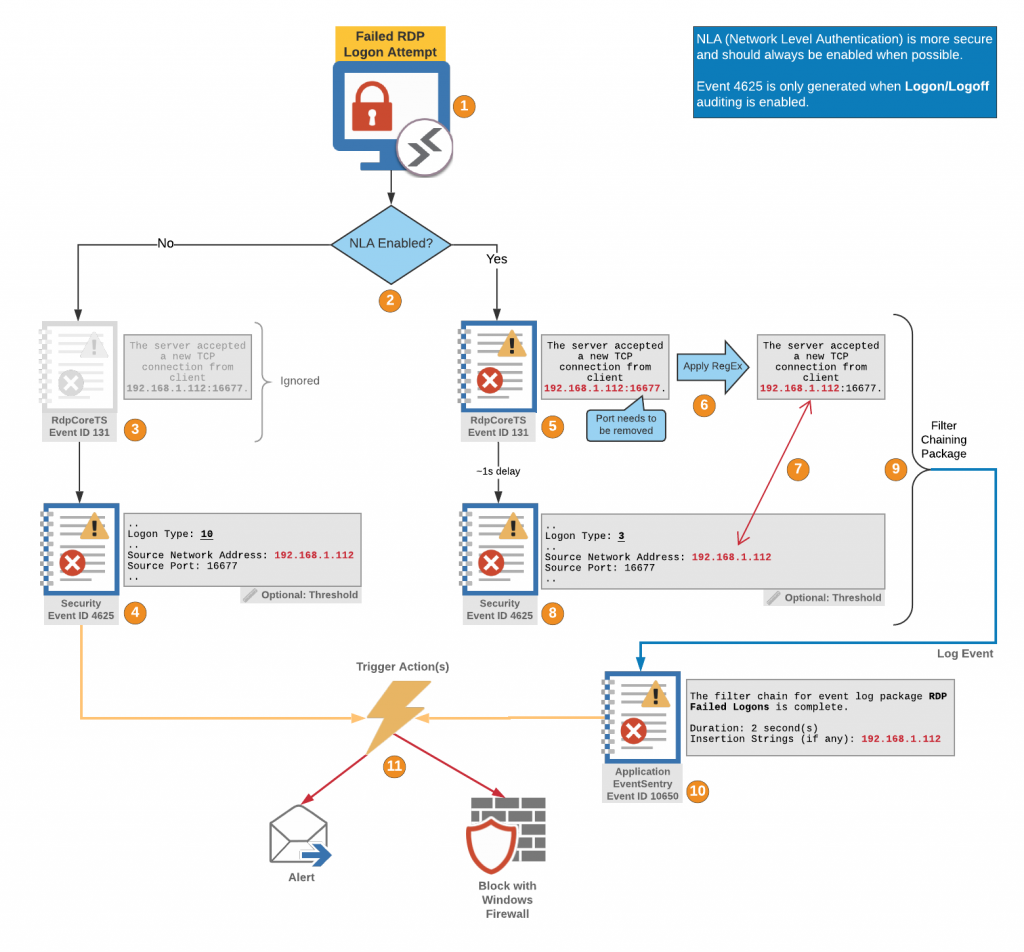
The diagram below visualizes how the failed RDP login detection works with EventSentry. When an unsuccessful login via RDP occurs (1), whether or not NLA is enabled (2) determines which type of 4625 event will be logged by Windows. The RDP subsystem logs event 131 either way (3), but we utilize it when NLA is active. Without NLA we simply utilize event 4625 (4) as the trigger for one or more actions, whereas with NLA being active we need to evaluate two different events.

With NLA enabled, event id 131 is evaluated first (5). Since event 131 is logged regardless of whether the subsequent authentication is successful or not, it needs to be correlated with a potential subsequent 4625 security event (8). In order to correlate those two events based on the IP address however, the remote port needs to be removed from event 131 so that only the IP address remains (6). Once event 131 is registered and reformatted, EventSentry will look for subsequent 4625 events (8) with a matching IP address (7).


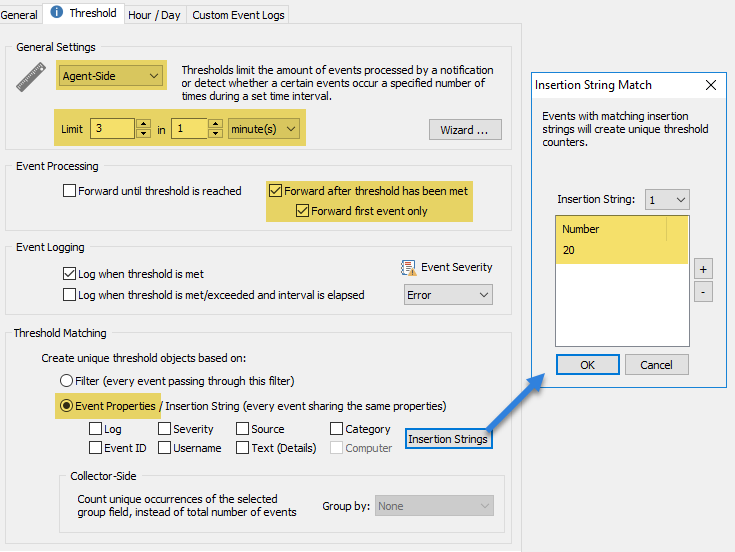
Note: Since blocking every failed RDP-based authentication could lock out legitimate users that enter an incorrect password by accident, it’s highly recommend to add a threshold for event 4625 (8). When downloaded from EventSentry, our 4625 filter has a default threshold of 3 in 1 minute per IP address. This means that hosts will be blocked if an incorrect password is specified 4 times within 1 minute (from the same IP address, that’s what insertion string 20 is for).

Filter threshold configuration

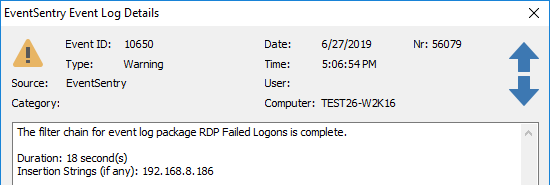
Correlating multiple events is the nature of a filter chaining package (9), which requires that all events listed in the package match during a specified time interval. Once all filters (131 + 4625 in this case) match, EventSentry will log event id 10650 to the application event log, specifying the name of the filter chaining package along with the time span and insertion string(s), the ip address in this case (10). That event is then used as the trigger for one or more actions (11), such as blocking the remote IP using the Windows firewall and/or for sending an email alert.

Blocking an IP address with Windows Firewall is easy and can be done with the netsh.exe command, for example:

%SYSTEMROOT%\system32\netsh.exe advfirewall firewall add rule name="$STR3 $YEAR-$MONTH-$DAY -- automatic block by EventSentry" dir=in interface=any action=block remoteip=$STR3/32

$YEAR, $MONTH and $DAY are variables that are generally always available in EventSentry, and $STR3 is the third insertion string from whichever event triggered the action. In our example we trigger netsh from event id 10650, which specifies the IP address in its insertion string %3:

The filter chain for event log package %1 is complete.

Duration: %2 second(s)
Insertion Strings (if any): %3

Below is the actual event as it would be found in the EventSentry event viewer. You can view the insertions strings with the EventSentry management console under Tools -> Utilities -> Event Message Browser or with the EventSentry SysAdmin Tools.

After we put everything together in EventSentry we end up with the following:

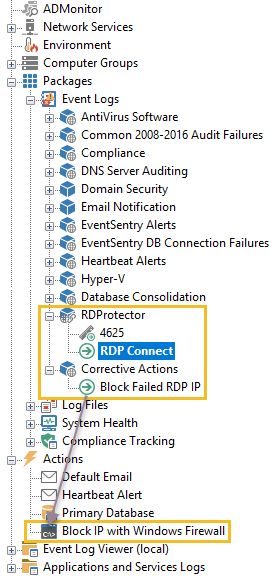
1. A Filter Chaining Package (“RDProtector”) which logs the above event when it detects failed RDP logons
2. A filter that triggers the firewall blocking from event 10650 (“Block Failed RDP IP”)
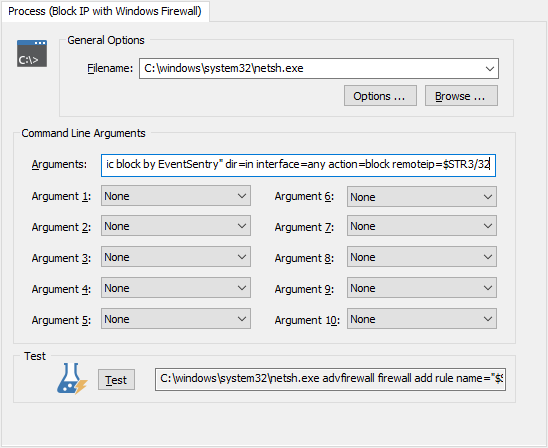
3. An action (“Block IP with Windows Firewall”) that calls netsh.exe to block an IP address

Newer EventSentry installations include the RDProtector package out of the box, but the package can also be downloaded through the Tools -> Download Packages feature. Keep in mind that both the “Corrective Actions” package and the “Block IP with Windows Firewall” action need to be created manually, their respective configuration is shown below.

The process command line (“Arguments”) should be: advfirewall firewall add rule name=”$STR3 $YEAR-$MONTH-$DAY — automatic block by EventSentry” dir=in interface=any action=block remoteip=$STR3/32

Rules added to the Windows firewall are perpetual of course, which – depending on the number of blocks – may result in a large number of Windows firewall rules. A somewhat easy work-around would be to launch a script that:

1. Creates the firewall rule
2. Waits a certain amount of time (e.g. 5 min)
3. Deletes the firewall rule again

A script with a 3-minute timeout would look slimilar to this:

advfirewall firewall add rule name="$STR3 $YEAR-$MONTH-$DAY -- automatic block by EventSentry" dir=in interface=any action=block remoteip=$STR3/32

timeout /t 180

advfirewall firewall delete rule name="$STR3 $YEAR-$MONTH-$DAY -- automatic block by EventSentry" dir=in

Stay safe out there.

EventSentry v4.0 – Introducing ADMonitor

Since Active Directory is the foundation of all Windows networks, monitoring Active Directory needs to be part of any comprehensive security strategy. Up to version 3.5, EventSentry utilized Windows auditing and the security event log to provide reports on:

  • User Account Changes
  • Group Changes
  • Computer Account Changes

While this functionality provides a good basis for monitoring the most relevant changes to Active Directory, we felt that a more comprehensive approach to monitoring Active Directory was needed – without the need to install & maintain yet another product!

ADMonitor is new (optional) component included in EventSentry that vastly improves Active Directory monitoring with these additional features:

  • Monitors changes to all objects (e.g. OUs) – not just users/groups/computers
  • Captures every attribute change made to an object, not just high level changes
  • Provides before & after values for all changes
  • Monitors Group Policy changes
  • User status reports (show idle users, users with non-expiring passwords, …)
  • Monitoring does not require auditing

We’re excited that we can now offer EventSentry ADMonitor to our users who are looking for a more in-depth Active Directory monitoring solution.

Active Directory is essentially a representation of the employees and their roles in your organization. But employees come and go, roles/responsibilities change, contractors get temporary access and so forth. But while adding users and additional access is usually reflected properly in Active Directory (otherwise IT would get a call because somebody presumably can’t do their job), removing access is often forgotten. As a result, users that should have been removed from AD a long time ago continue to exist. With ADMonitor it’s easy to identify orphaned user accounts (and many others) and keep your Active Directory lean and clean.

Discover weak links in Active Directory

Since a significant development effort stands behind ADMonitor, it will be offered as an optional component that is licensed on a per-user basis. Pricing is very competitive with other solutions and we also offer bundle discounts to customers who already own or will purchase agent licenses; please request a quote here.

But enough theory, let’s look into the installation, configuration and reporting of ADMonitor.

Installation

Since ADMonitor is a component of EventSentry, it’s easily activated as part of the main EventSentry setup. Just like with other components of EventSentry (Heartbeat Monitor, Collector, …), users have the option to enable ADMonitor during the post installation setup procedure.

ADMonitor can be installed on any host that is part of the domain that needs to be monitored, it does not need to be installed on a domain controller.

Enabling ADMonitor
Enabling ADMonitor

Immediately following the initial installation, ADMonitor will initialize itself by creating an offline copy of all Active Directory objects. This process can take from a few seconds to a few minutes, depending on the number of objects in AD, connection speed to the domain controller as well as the overall performance of the host running ADMonitor.

Configuration

The initial configuration of ADMonitor is simple and only requires you to pick a password for the ADMonitor service account. If you’re adding ADMonitor to an existing installation you may also need to select the appropriate EventSentry database action to which ADMonitor reports changes. Otherwise, ADMonitor is ready from the get go and will monitor all Active Directory changes.

Reporting

ADMonitor provides three types of reports:

  • Object Changes
  • Group Policy Changes
  • User Status

Object Changes
Shows any change made to an AD objects. Reports can be filtered on the type of action performed (added, removed, modified), on the object type (user, group, organizationalUnit, …) and on the user who performed the action.

ADMonitor Object Change
ADMonitor Object Changes

Note that the detailed changes to group policies are available in the “Group Policy Changes” report below. Of course you can expect the same type of summary view you’re already used to from most other EventSentry features and create reports like:

  • Show all changes to organizational units
  • Show all new objects created
  • Show all users that were changed
  • and more

Group Policy Changes
When a group policy is changed, it is first indicated on the “Object Changes” report, since the versionNumber attribute of the AD object changes. The actual group policy settings themselves are available on the “Group Policy Changes” report however, since group policy settings are not stored in AD.

The screen shot below shows that the Default Domain Policy was changed, with the Specify traps for the public community setting being enabled.

ADMonitor Group Policy Change

Users
The users report helps you identify potentially problematic user accounts such as idle users, users who haven’t change their passwords in years and others.

This report contains a list of all user objects in Active Directory including the following details:

  • Name, Full Name, SAM Account Name, Path, UPN
  • Administrative Account (yes/no)
  • Disabled (yes/no)
  • Password Never Expires (yes/no)
  • Password Expired (yes/no)
  • Password must change (yes/no)
  • Locked Out (yes/no)
  • Last Logon
  • Password Last Set
  • Account Expiration Date
  • Creation Date

ADMonitor User Overview

With ADMonitor you can now get detailed user stats with just a few clicks and quickly identify user accounts that need to be reviewed, changed or deleted. Of course you can also schedule all reports directly from the web reports and get daily/weekly AD status reports directly in your inbox, e.g.:

  • List of all Group Policy changes
  • List of all idle user accounts
  • List of all newly created users and/or groups

You can also create your own reports for just about anything that involves a change to an Active Directory object, for example all organizational units created in the last 24 hours.

ADMonitor also includes a number of stand-alone utilities that support advanced features such as filtering and email notifications that I will cover in a future post.

With ADMonitor, EventSentry users can now gain the additional visibility needed to fully audit all Active Directory & Group Policy changes. As a result, EventSentry users can more easily enhance compliance, security and accountability in their network without the need to install additional software – saving both time and money.