How to dynamically toggle your Wireless adapter with EventSentry

Most of the time I work on a Lenovo laptop running Windows 7, and I’m overall quite happy with the laptop (especially after the mainboard was replaced and it stopped randomly rebooting). However, a minor nuance had been bugging me for a while: If I plugged my computer into a LAN (I have a docking station at work and at home) while a wireless signal was also available (and configured on the laptop), Windows 7 would keep both connections active.

1. The Problem

So I’d have my laptop in the docking station, connected to a 1Gb Ethernet network, and yet the laptop would also be connected to a WiFi network. While not a big deal per se, it does have a few advantages to automatically disable the WiFi connection when already connected to Ethernet:

  • Avoid potential connectivity issues
  • Increase security by not transmitting data via Wifi when not necessary
  • Increase battery life when connected to a LAN
  • Because you can!

Now, Lenovo equips most (if not all) laptops with a software called “Access Connections”, a pretty nifty and free tool! One of the things it can do, is disable a Wireless adapter when the computer is connected to Ethernet. However, it never re-enables it when you disconnect from the wired network (at least I haven’t found a way), and besides not everybody has Lenovo laptop.

So how could I disable the WiFi connection automatically when I connected the laptop to an Ethernet, yet automatically re-enable it when there is no Ethernet connection?

2. The Research

After some intense brainstorming, I remembered two things:

  1. Most Ethernet NIC drivers log event to the System event log when a network port is connected/disconnected.
  2. A while back, I used the netsh command to configure DNS servers from the command line. Maybe one could toggle the state of network adapters with this tool as well?

3. Evidence Gathering

The first one was easy, a quick look at the system event log revealed the following event:
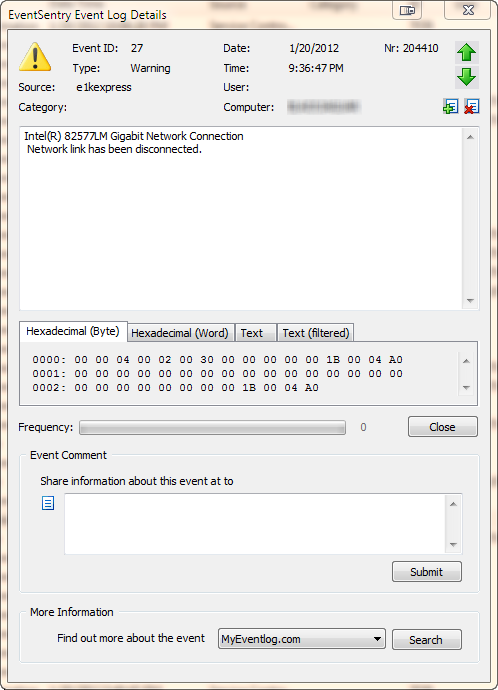
e1kexpress_event.pngA similar event is logged when the “network link” has connected. The event shown here is specific to the driver of my laptop’s network card (an Intel(R) 82577LM adapter), but most newer drivers will log events when a cable is disconnected or the link is otherwise lost. If you are already running EventSentry with its hardware inventory feature enabled, then you can obtain the name of the network adapter from any monitored host on the network through the hardware inventory page, an example is shown below.

all_nics.pngComing up with a way to enable and disable a particular network connection with netsh.exe was a bit more challenging, but I eventually cracked the cryptic command line parameters of netsh.exe.

Enable a connection
netsh interface set interface “Wireless Network Connection” ENABLED

Disable a connection

netsh interface set interface “Wireless Network Connection” DISABLED

And yes, you do need to specify the word “interface” twice. If you do find yourself wanting to automate network adapter settings with scripts and/or the command line frequently, then you should check out this link.

4. The Solution

So now that we have all the ingredients, let’s take a look at the recipe. In order to accomplish the automatic interface toggling, we need to create:

  • an embedded script called wifi_enable.cmd, using the command line from above
  • an embedded script called wifi_disable.cmd, again using the command line from above
  • a process action “Wifi Enable”, referencing the above wifi_enable.cmd embedded script
  • a process action “Wifi Disable”, referencing the above wifi_disable.cmd embedded script
  • an event log filter for event source “e1kexpress” and event id 27, triggering the “Wifi Enable” action
  • an event log filter for event source “e1kexpress” and event id 32, triggering the “Wifi Disable” action

A couple of clarifications: First, you do not need to use embedded scripts, you can create the scripts in the file system too and then point the process action to those files. I prefer embedded scripts since I don’t have to worry about maintaining the script, as it gets distributed to remote hosts automatically when needed. Second, the event source and event id will depend on the network card you have installed on your network, the above example will only work with Lenovo T410 laptops.

So what happens is pretty straightforward: When I connect my laptop to a LAN, the Intel NIC driver writes event id 32 with the event source e1kexpress to the system event log. EventSentry intercepts the event and triggers the Wifi Disable action, which in turns runs the netsh.exe process, disabling the WiFi connection.

5. Setting it up in the management console

Embedded Scripts

You can manage embedded scripts via Tools -> Embedded Scripts. Click “New”, specify a descriptive name (e.g. wifi_enable.cmd) and paste the command line netsh interface set interface “Wireless Network Connection” ENABLED into the script content window. Then, do the same for the wifi_disable.cmd script, but this time use the netsh interface set interface “Wireless Network Connection” DISABLED command line. You can leave the interpreter empty as long as you give the filename the .cmd extension.

embedded_script.pngActions

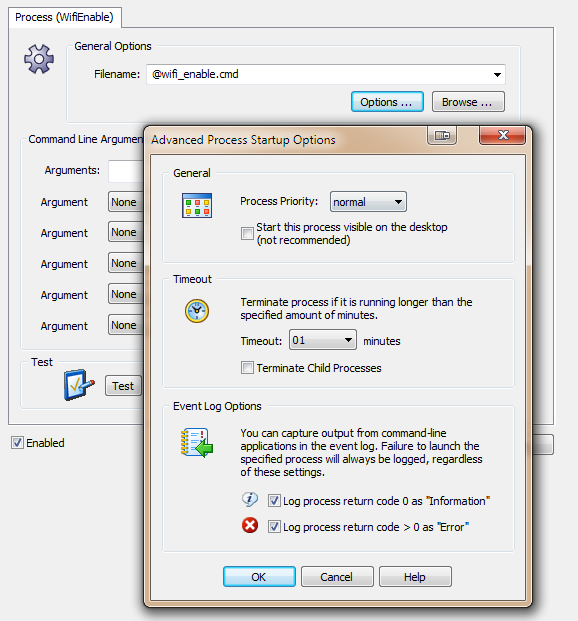
Create two process actions, one pointing to wifi_enable.cmd, and one pointing to wifi_disable.cmd. You can access these embedded scripts by clicking the pull-down – you should see the embedded script(s) you created in step one – each prefixed with the @ symbol. The resulting dialog should look like this:

process_wifi_enable.pngI recommend enabling both “Event Log Options”, as this will help with troubleshooting. Now we just need the event log filters, and we are all set.

Like I mentioned earlier, you can also reference any external process or .cmd file with the process action, if you’d rather not use embedded scripts.

Event Log Filters
Since we’ll need two filter, we’ll create a new event log package called “Toggle Wifi” by right-clicking the “Event Log Packages” container and selecting “Add Package”. Inside the package we can then add the two filters: One to trigger the “Wifi Enable” action when the NIC drivers logs its event indicating that the network cable was unplugged, and one that will trigger the “Wifi Disable” action when the NIC drivers logs that the network cable was plugged in. The filter will look similar to this, but note that the event source as well as event id will depend on the network card and driver.
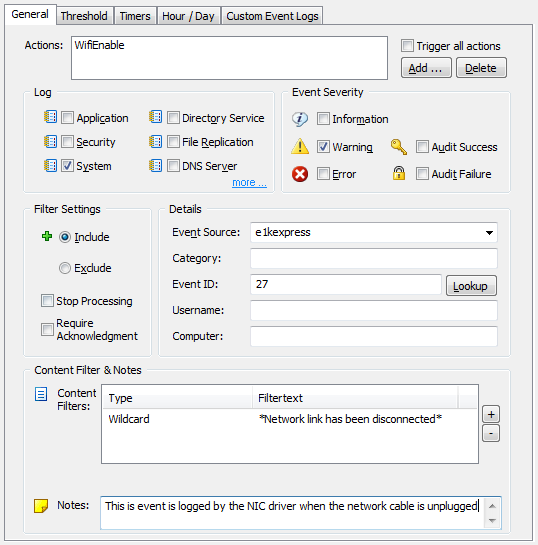
filter_wifi_enable.pngThat’s pretty much it. If you enabled the event log options in the process action earlier, then you can see the output from the process action in the event log, as shown below:
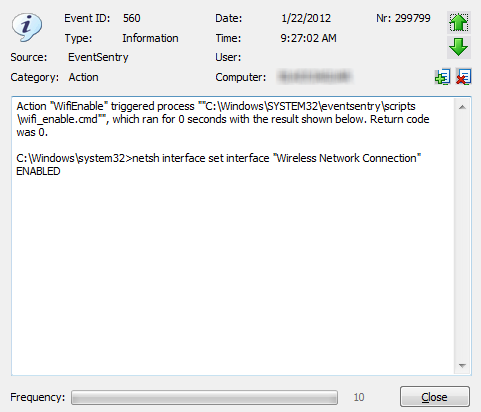
event_action.pngHere are some links to the official EventSentry documentation regarding the features used:

EventSentry v2.92 + iPhone App

EventSentry v2.92
The main new features in version 2.92 are:

  • Network Services component
  • Embedded performance / environment charts
  • HTTP action
  • Hardware Inventory & Monitoring

Please see the release history or the documentation for a complete list of all bug fixes and new features.

Network Services
The network services component is the main new feature in EventSentry, and adds powerful functionality – the ability to receive SNMP traps – to our monitoring solution. Any network device that supports SNMP v1, v2c or v3 can be configured to send traps to EventSentry, which can then either forward the trap details via email, or log them to the database for archival and searching purposes.

Unlike other products, configuring the snmp trap daemon is easy and uncomplicated. Simply specify any MIBs you want to load, configure any SNMP communities and/or v3 users, and (optionally) setup text filters to include/exclude specific traps based on their content.

The network services component now also includes the syslog daemon, which was previously embedded in the EventSentry agent. This change includes higher availability, since the network services will cache incoming (snmp and/or syslog) packets if the main database is temporarily unavailable.

Another new “feature” is the ability to run the network services daemon on Linux and OS X operating systems. We developed all code in the network services to run on multiple platforms, and will continue to do so with all upcoming new components in EventSentry. Cross-platform functionality is still experimental, and as such we don’t currently have an installer for non-Windows operating systems. If you are interested in running the network services daemon on Linux or OS X, then please send a request to our support team.

Visualizing performance and environment data with embedded charts
Performance monitoring and alerts have always been a popular and useful feature in EventSentry, but a numerical alert can only convey so much information. If an alert shows that the CPU usage has been exceeded, say 80% over a time period of 10 minutes, then it is often helpful to see the performance data in a chart. This would show whether the CPU usage spiked during the beginning of the 10-minute interval and is back in an acceptable range, or whether the CPU usage has been mostly constant. In the past, you would need to review the performance history through the web-based reporting (which is still an option and desirable for long-term analysis), but starting with v2.92 email alerts can now include an embedded chart which shows exact performance information from the monitored time interval.

For example, if your performance alert is configured to generate an alert when the CPU usage exceeds 90% for more than 30 minutes, then you can receive an attachment in addition to the text alert, showing performance data from the last 30 minutes.

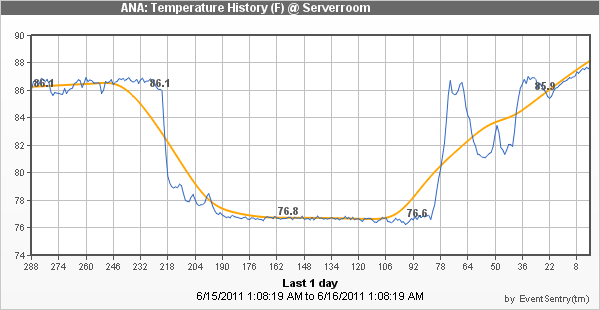
eventsentry_attachment_performance.pngEmbedded charts are also included with temperature and/or humidity environment alerts, an example chart is shown below:

eventsentry_attachment_environment.png

HTTP Action
To better interact with web-based solutions like iService, EventSentry now includes a new notification type: HTTP. With the new HTTP action, you can submit event data to any HTTP or HTTPS-based form, making it extremely easy and reliable to interact with web-based systems (e.g. ticketing systems). Setting up a HTTP action is easy: Simply provide the URL, authentication and specify any event fields that you want to submit.

Hardware Inventory & Monitoring
Also new are network link speed monitoring, which can alert you when the NIC speed changes. This can be useful if a host is accidentally connected to a different switch, or simply to inventory all network connections.

EventSentry also monitors connected USB storage devices and can alert you when a drive is added or removed. The S.M.A.R.T. status of drives is also monitored, and junction points are now taken into consideration when evaluating the disk space of a logical drive. Also new is a “physical disks” section in the web reports.

iPhone App
Why yes, there is an app for that! How convenient would it be to review the health status of all your monitored hosts from your iPhone – including health statistics, hardware details and more?

Dream no more, with the EventSentry iPhone app you can review the status of all your servers from your phone (so long as it has access to your web reports of course).

Upon launch the app shows a searchable list of all monitored hosts and their respective health status. Tapping on a host will show detailed information, such as performance data, hardware information and more. Please take a look at the official iTunes page for the EventSentry app for more information and screenshots.

If you are an Android user then there is no reason to worry, an Android version of the EventSentry Mobile app is planned later this year.

Again, please see the version history for a complete list of features and fixes in v2.92.

Do not trust thee RAID alone

I’m assuming that most readers are familiar with what RAID, the “Redundant Array of Inexpensive Disks”, is. Using RAID for disk redundancy has been around for a long time, apparently first mentioned in 1987 at the University of California, Berkeley (see also: The Story So Far: The History of RAID). I’m honestly not sure why they chose the term “inexpensive” back in 1987 (I suppose “RAD” isn’t as catchy of a name), but regardless of the wording, a RAID is a fairly easy way to protect yourself against hard drive failure. Presumably, any production server will have a RAID these days, especially with hard drives being as inexpensive as they are today (unless you purchase them list price from major hardware vendors, that is). Another reason why RAID is popular, is of course the fact that hard drives are probably the most common component to break in a computer. You can’t really blame them either, they do have to spin an awful lot.

burnt_server.jpg

Lesson #1: Don’t neglect your backups because you are using RAID arrays
That being said, we recently had an unpleasant and unexpected issue in our office with a self-built server. While it is a production server, it is not a very critical one, and as such a down-time of 1-2 days with a machine like that is acceptable (albeit not necessarily desired). Unlike the majority of our “brand-name” servers, which are under active support contracts, this machine was using standard PC components (it’s one of our older machines), including an onboard RAID that we utilized for both the OS drive as well as the data drive (it has four disks, both in a RAID 1 mirror). Naturally, the machine is monitored through EventSentry.

Well, one gray night it happened – one of the hard drives failed and a bunch of events (see myeventlog.com for an example) were logged to the event log, and immediately emailed to us. After disappointingly reviewing the emails, the anticipated procedure was straightforward:

1) Obtain replacement hard drive
2) Shut down server
3) Replace failed hard drive
4) Boot server
5) Watch RAID rebuilding while sipping caffeinated beverage

The first 2 steps went smoothly, but that’s unfortunately how far our IT team got. The first challenge was to identify the failed hard drive. Since they weren’t in a hot-swappable enclosure, and the events didn’t indicate which drive had failed, we chose to go the safe route and test each one of them with the vendors supplied hard drive test utility. I say safe, because it’s possible that a failed hard drive might work again for a short period of time after a reboot, so without testing the drives you could potentially hook the wrong drive up. So, it’s usually a good idea to spend a little bit of extra time in that case, to determine which one the culprit is.

Eventually, the failed hard drive was identified, replaced with the new (exact and identical) drive, connected, and booted again. Now normally, when connecting an empty hard drive, the raid controller initiates a rebuild, and all is well. In this case however, the built-in NVidia RAID controller would not recognize the RAID array anymore. Instead, it congratulates us on having installed two new disks. Ugh. Apparently, the RAID was no more – it was gone –  pretty much any IT guys nightmare.

No matter what we tried, including different combinations, re-creating the original setup with the failed disks, trying the mirrored drive by itself, the RAID was simply a goner. I can’t retell all the things that were tried, but we ultimately had to re-create the RAID (resulting in an empty drive), and restore from backup.

We never did find out why the RAID 1 mirror that was originally setup was not recognized anymore, and we suspect that a bug in the controller firmware caused the RAID configuration to be lost. But regardless of what was ultimately the cause, it shows that even entire RAID arrays may fail. Don’t relax your backup policy just because you have a RAID configured on a server.

Lesson #2: Use highly reliable RAID levels, or configure a hot spare
Now I’ll admit, the majority of you are running your production servers on brand-name machines, probably with a RAID1 or RAID5, presumably under maintenance contracts that ship replacement drives within 24 hours or less. And while that does sound good and give you comfort, it might actually not be enough for critical machines.

Once a drive in a RAID5 or RAID1 fails, the RAID array is in a degraded state and you’re starting to walk on very thin ice. At this point, of course, any further disk failure will require a restore from backup. And that’s usually not something you want.

So how could a RAID 5 not be sufficiently safe? Please, please: Let me explain.

Remember that the RAID array won’t be fully fault tolerant until the RAID array is rebuilt – which might be many hours AFTER you plug in the repaired disk depending on the size, speed and so forth. And it is during the rebuild period that the functional disks will have to work harder than usual, since the parity or mirror will have to be re-created from scratch, based on the existing data.

Is a subsequent disk failure really likely though? It’s already pretty unlikely a disk fails in the first place – I mean disks don’t usually fail every other week. It is however much more likely than you’d think, somewhat depending on whether the disks are related to each other. What I mean with related, is whether they come from the same batch. If there was a problem in the production process – resulting in a faulty batch – then it’s actually quite likely that another bites the dust sooner rather than later. It happened to a lot of people – trust me.

But even if the disks are not related, they probably still have the same age and wear and, as such, are likely to fail in a similar time frame. And, like mentioned before, the RAID array rebuild process will put a lot of strain on the existing disks. If any disk is already on its last leg, then a failure will be that much more likely during the RAID array rebuild process.

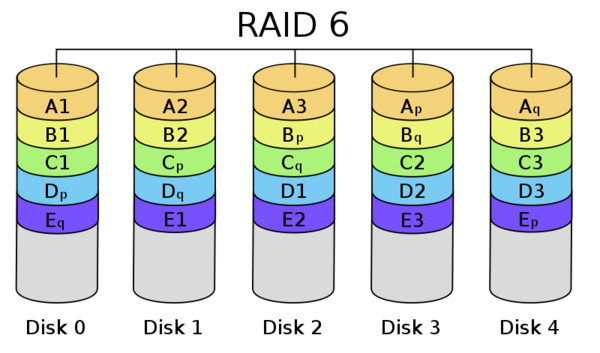
raid6.pngRAID 6, if supported by your controller, is usually preferable to a RAID5, as it includes two parity blocks, allowing up to two drives to fail. RAID 10 is also a better option with potentially better performances, as it too continues to operate even when two disks fail (as long as it’s not the disks that are mirrored). You can also add a hot spare disk, which is a stand-by disk that will replace the failed disk immediately.

If you’re not 100% familiar with the difference between RAID 0, 1, 5, 6, 10 etc. then you should check out this Wikipedia article: It outlines all RAID levels pretty well.

Of course, a RAID level that provides higher availability is usually less efficient in regards to storage. As such, a common counterargument against using a more reliable RAID level is the additional cost associated with it. But when designing your next RAID, ask yourself whether the savings of an additional hard drive is worth the additional risk, and the potential of having to restore from a backup. I’m pretty sure that in most cases, it’s not.

Lesson #3: Ensure you receive notifications when a RAID array is degraded
Being in the monitoring business, I need to bring up another extremely
important point: Do you know when a drive has failed? It doesn’t help much to have a RAID when you don’t know when one or more drives have failed.

Most server
management software can notify you via email, SNMP and such – assuming
it’s configured. Since critical events like this almost always trigger
event log alerts as well though, a monitoring solution like EventSentry can simplify the notification process.
Since EventSentry monitors event logs, syslog as well as SNMP traps, you can take a uniform approach to notifications. EventSentry can notify you of RAID failures regardless of the hardware vendor you
use – you just need to make sure the controller logs the error to the
event log.

Lesson #4+5: Test Backups, and store backups off-site
Of course one can’t discuss reliability and backups without preaching the usual. Test your backups, and store (at least the most critical ones) off-site.

Yes, testing backups is a pain, and quite often it’s difficult as well and requires a substantial time commitment. Is testing backups overkill, something only pessimistic paranoids do? I’m not sure. But we learned our lessen the hard way when all of our 2008 backups were essentially incomplete, due to a missing command-line switch that recorded (or in our case did not) the system state. We discovered this after, well, we could NOT restore a server from a backup. Trust me: Having to restore a failed server and having only an incomplete, out-of-date or broken backup, is not a situation you want to find yourself in.

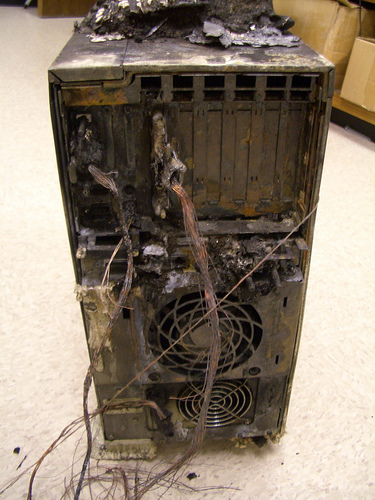
My last recommendation is off-site storage. Yes, you have a sprinkler system, building security and feel comfortably safe. But look at the picture on top. Are you prepared for that? If not, then you should probably look into off-site backups.

So, let me recap:

1. Don’t neglect your backups because you are using RAID arrays.
2. Use highly reliable RAID levels, or configure a hot spare.
3. Ensure you receive notifications when a RAID array is degraded
4. Test your backups regularly, but at the very least test them once to ensure they work.
5. Store your backups, or at least the most critical, off-site.

Stay redundant,
Ingmar.

Read more

Creating your very own event message DLL

If you’ve ever wrote code to log to the Windows event log before (e.g. through Perl, Python, …), then you might have run into a similar problem that I described in an earlier post: Either the events don’t look correctly in the event log, you are restricted to a small range of event ids (as is the case with eventcreate.exe) or you cannot utilize insertion strings.

In this blog post I’ll be showing you how to build a custom event message DLL, and we’ll go about from the beginning to the end. We’ll start with creating the DLL using Visual Studio (Express) and finish up with some example scripts, including Perl of course, to utilize the DLL and log elegantly to the event log.

Let’s say you are running custom scripts on a regular basis in your network – maybe with Perl, Python, Ruby etc. Your tasks, binary as they are, usually do one of two things: They run successfully, or they fail. To make troubleshooting easier, you want to log any results to the event log – in a clean manner. Maybe you even have sysadmins in other countries and want to give them the ability to translate standard error messages. Logging to the event log has a number of benefits: It gives you a centralized record of your tasks, allows for translation, and gives you the ability to respond to errors immediately (well, I’m of course assuming you are using an event log monitoring solution such as EventSentry). Sounds interesting? Read on!

Yes, you can do all this, and impress your peers, by creating your own event message file. And what’s even better, is that you can do so using all free tools. Once you have your very own event message file, you can utilize it from any application that logs to the event log, be it a PowerShell/perl/python/… script or a C/C++/C#/… application.

To create an event message file, you need two applications:

The reason you need the platform SDK, is because Visual Studio Express does not ship with the Message Compiler, mc.exe, for some reason. The message file compiler is essential, as without it there will be no event message file unfortunately. When installing the platform SDK, you can deselect all options except for “Developer Tools -> Windows Development Tools -> Win32 Development Tools” if you want to conserve space. This is the only essential component of the SDK that’s needed.

An event message file is essentially a specific type of resource that can be embedded in either a DLL file or executable. In EventSentry, we originally embedded the message file resources in a separate DLL, but eventually moved it into the executable, mostly for cleaner and easier deployment. We’ll probably go back to a separate message DLL again in the future, mostly because processes (e.g. the Windows Event Viewer) can lock the event message file (the executable in our case), making it difficult to update the file.

Since embedding an event message file in a DLL is more flexible and significantly easier to accomplish, I’ll be covering this scenario here. The DLL won’t actually contain any executable code, it will simply serve as a container for the event definitions that will be stored inside the .dll file. While it may sound a little bit involved to build a DLL just for the purpose of having an event message file (especially to non-developers), you will see that it is actually surprisingly easy. There is absolutely no C/C++ coding required, and I also made a sample project available for download, which has everything setup and ready to go.

In a nutshell, the basic steps of creating an event message file are as follows:

1. Create a message file (e.g. messagefile.mc)
2. Convert the message file into a DLL, using mc.exe, rc.exe and link.exe

Once we have the message file, we will also need to register the event message file in the registry, and associate it with an event source. Keep in mind that the event source is not hard-coded into the message file itself, and in theory a single event message file could be associated with multiple event sources (as is the case with many event sources from Windows).

So let’s start by creating a working folder for the project, and I will call it “myapp_msgfile”. Inside that directory we’ll create the message file, let’s call it myapp_msgfile.mc. This file is a simple text file, and you can edit it with your favorite text editor (such as Ultraedit, Notepad2 or Notepad++).

The file with the .mc extension is the main message file that we’ll be editing – here we define our event ids, categories and so forth. Below is an example, based on the scenario from before. Explanations are shown inline.


MessageIdTypedef=WORD

LanguageNames=(
English=0x409:MSG00409
German=0x407:MSG00407
)

Here we define which languages we support, and by which files these languages will be backed. You will have to look up the language id for other languages if you plan on supporting more, and you can remove German if you only plan on supporting English.


MessageId=1
SymbolicName=MYTOOL_CATEGORY_GENERAL
Language=English
Tasks
.
Language=German
Jobs
.

Our first event id, #1, will be used for categories. Categories work in the exact same way as event ids. When we log an event to the event log and want to include a category, then we only log the number – 1 in this case.


MessageId=100
SymbolicName=TASK_OK
Language=English
Task %1 (%2) completed successfully.
.
Language=German
Job %1 (%2) war erfolgreich.
.

This is the first event description. The “MessageId” field specifies the event id, and the symbolic name is a descriptive and unique name for the event. The language specifies one of the supported languages, followed by the event message text. You end the event description with a single period – that period has to be the only character per line.


MessageId=101
SymbolicName=TASK_ERROR
Language=English
Task %1 (%2) failed to complete due to error “%3”.
.
Language=German
Job %1 (%2) konnte wegen Fehler “%3” nicht abgeschlossen werden.
.

MessageId=102
SymbolicName=TASK_INFO
Language=English
Task Information: %1
.
Language=German
Job Information: %1
.

Since we’re trying to create events for “custom task engine”, we need both success and failure events here. And voila, our event message file now has events 100 – 102, plus an id for a category.

So now that we have our events defined, we need to convert that into a DLL. The first step now is to use the message compiler, mc.exe, to create a .rc file as well as the .bin files. The message compiler will create a .bin file for every language that is defined in the mc file. Open the “Visual Studio Command Prompt (2010)” in order for the following commands to work:


mc.exe myapp_msgfile.mc

will create (for the .mc file depicted above):


myapp_msgfile.rc
msg00407.bin
msg00409.bin

With those files created, we can now create a .res (resource) file with the resource compiler rc.exe:


rc.exe /r myapp_msgfile.rc

which will create the


myapp_msgfile.res

file. The “/r” option instructs the resource compile to emit a .res file. Now we’re almost done, we’re going to let the linker do the rest of the work for us:


link -dll -noentry -out:myapp_msgfile.dll myapp_msgfile.res

The myapp_msgfile.res is the only input file to the linker, normally one would supply object (.obj) files to the linker to create a binary file. The “-noentry” option tells the linker that the DLL does not have an entry point, meaning that we do not need to supply a DllMain() function – thus the linker is satisfied even without any object files. This is of course desired, since we’re not looking to create a DLL that has any code or logic in it.

After running link.exe, we’ll end up with the long awaited myapp_msgfile.dll file.

The end. Well, almost. Our message file is at this point just a lone accumulation of zeros and ones, so we need to tell Windows that this is actually a message file for a particular event log and source. That’s done through the registry, as follows:

Open the registry editor regedit.exe. Be extremely careful here, the registry editor is a powerful tool, and needs to be used responsibly :-).

All event message files are registered under the following key:


HKLM\System\CurrentControlSet\Services\eventlog

Under this key, you will find a key for every event log as well as subkeys for every registered event source. So in essence, the path to an event source looks like this:


HKLM\System\CurrentControlSet\Services\eventlog\EVENTLOG\EVENTSOURCE

I’m going to assume here that we are going to be logging to the application event log, so we’d need to create the following key:


HKLM\System\CurrentControlSet\Services\eventlog\Application\MyApp

In this key, we need to following values:


TypesSupported (REG_DWORD)
EventMessageFile (REG_EXPAND_SZ)

TypesSupported is usually 7, indicating that the application will log either Information, Warning or Error events (you get 7 if you OR 1[error], 2[warning] and 4[information] together).

EventMessageFile is the path to your message DLL. Since the type is REG_EXPAND_SZ, the path may contain environment variables.

If you plan on utilizing categories as well, which I highly recommend (and for which our message file is already setup), then you need two additional values:


CategoryCount (REG_DWORD)
CategoryMessageFile (REG_EXPAND_SZ)

CategoryCount simply contains the total number of categories in your message file (1, in our case), and the CategoryMessageFile points to our message DLL. Make sure that your message file does not contain any sequence gaps, so if your CategoryCount is set to 10, then you need to have an entry for every id from 1 to 10 in the message file.

We could create separate message files for messages and categories, but that would be overkill for a small project like this.

Now that we have that fancy message DLL ready to go, we need to start logging. Below are some examples of how you can log to the event log with a scripting language. I’ll be covering Perl, Kix, and Python. Me being an old Perl fan and veteran, I’ll cover that first.

PERL
The nice thing about Perl is that you can take full advantage of insertion strings, so it can support event definitions containing more than one insertion string.


use strict;
use Win32::EventLog;


# Call this function to log an event

sub logMessage
{
my ($eventID, $eventType, @eventDetails) = @_;

my $evtHandle = Win32::EventLog->new(“Your Software Application”);

my %eventProperties;

   # Category is optional, specify only if message file contains entries for categories

$eventProperties{Category}      = 0;
$eventProperties{EventID}       = $eventID;
$eventProperties{EventType}     = $eventType;
$eventProperties{Strings}       = join("\0", @eventDetails);

$evtHandle->Report(\%eventProperties);

$evtHandle->Close;
}


# This is what you would use in your scripts to log to the event log. The insertion strings
# are passed as an array, so even if you only have one string, you would need to pass it
# within brackets (“This is my message”) as the last parameter

logMessage(100, EVENTLOG_INFORMATION_TYPE, (“Database Backup”, “Monitoring Database”, “Complete”));
logMessage(102, EVENTLOG_INFORMATION_TYPE, (“Step 1/3 Complete”));


PYTHON

Python supports event logging very well too, including multiple insertion strings. See the sample code below:


import win32evtlogutil
import win32evtlog


# Here we define our event source and category, which we consider static throughout
# the application. You can change this if the category is different

eventDetails = {‘Source’: ‘MyApp’,    # this is id from the message file
‘Category’: 1}        # which was set aside for the category


# Call this function to log an event

def logMessage(eventID, eventType, message, eventDetails):
if type(message) == type(str()):
message = (message,)
win32evtlogutil.ReportEvent(eventDetails[‘Source’], eventID, eventDetails[‘Category’], eventType, tuple(message))

logMessage(100, win32evtlog.EVENTLOG_INFORMATION_TYPE, (“Database Backup”, “Monitoring Database”), eventDetails)
logMessage(102, win32evtlog.EVENTLOG_INFORMATION_TYPE, (“Step 1/3 complete”), eventDetails)

KIXTART
The pro: Logging to the event log using KiXtart is so easy it’s almost scary. The con: It only supports message files that use one insertion string.


LOGEVENT(4, 102, "Database Backup", "", "MyApp")