Announcing EventSentry v2.91

Now that EventSentry v2.91 has been released, I’m happy to have the opportunity to blog about our monitoring solution again.

The most significant new feature in EventSentry is the Health Matrix, a new way to see your network status in a space-efficient way. In fact, you can see the overall health status of your entire network on a single screen, even if it consists of hundreds of hosts.

We also made numerous other changes throughout the web reports, and added some exciting new filtering capabilities with our event log filters, as well as improved speed with the event log engine and file checksum generations.

EventSentry v2.91 also includes many minor improvements throughout the application, including service monitoring, process tracking and more. We have also updated EventSentry Light, and a new version will be released in the coming days after we have completed testing.

But now to the new features in version 2.91:
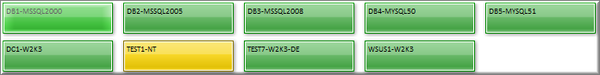
Health Matrix
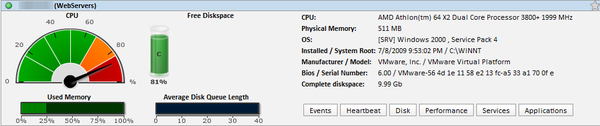
In the health matrix, each host is displayed as a colored square, circle or rectangle, with the color indicating the overall health of the monitored computer. When all of the monitored components of a host are in an OK status, the color of the square is green. The color will change to orange or red when a problem is detected, depending on the number or severity of the issue.

clip0580.png
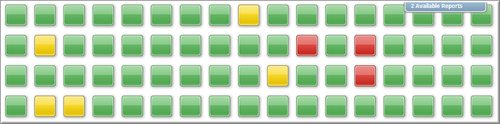
The health matrix is highly customizable, for example both the size and shape of the icons can be adjusted depending on the size of the network (and your monitor).

clip0583.pngEvent Log Monitoring
In 2.91, the event log filtering engine was improved, resulting in reduced CPU usage of the event log monitoring component. Since the CPU usage of the EventSentry agent is already quite low, you will most likely only notice this improvement on hosts that generate an extremely large number of events, such as domain controllers.

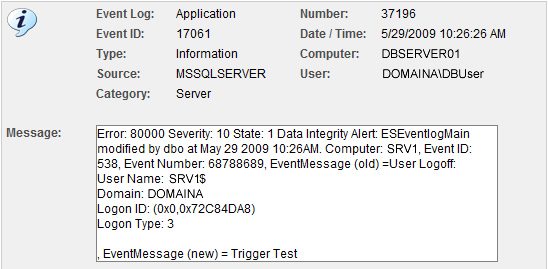
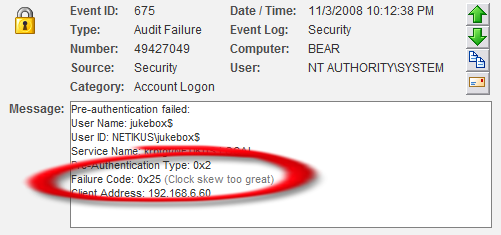
Also new is the ability to filter events based on insertion strings in addition to just filtering based on the event message text. This means that one can now match individual strings inside event messages against strings, numbers, file checksums and group memberships. If you are not familiar with the term “insertion string”, then I highly recommend my previous post about event message files before you read on.

Consider the following hypothetical example: The environment-monitoring component of EventSentry logs event id 10908:

The temperature (78.21 degrees F) has fallen outside the configured range (60F to 76F).

which is defined as:

The temperature (%3 degrees %4) has fallen outside the configured range (%1%4 to %2%4).

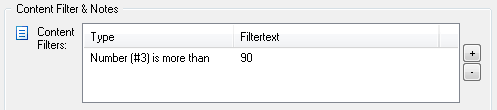
This event obviously informs us, that the current temperature has exceeded a set limit. Now let’s say that we wanted to get an email when the temperature exceeds the limit, but also send a page when the temperature exceeds 90 degrees.

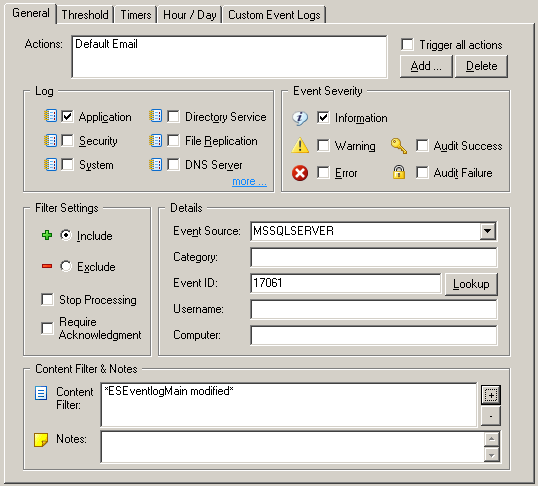
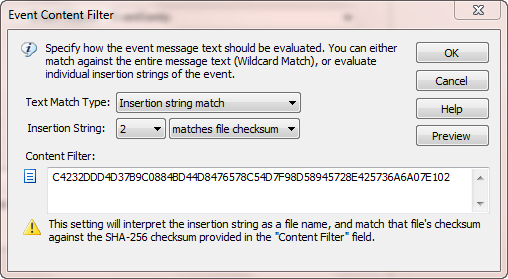
The new filtering feature allows you to do just that, by using the numerical comparison functionality with insertion strings (of course you would also need to set the hour/day properties). Assuming that you already have a filter in place for regular email notifications, you would simply setup an additional include filter that would evaluate insertion string 3 (%3) and only match if the number is above 90. See the screen shot below for the example. The result is a filter that only matches when then the temperature exceeds 90 degrees.

blog_es291_filter_1a.png
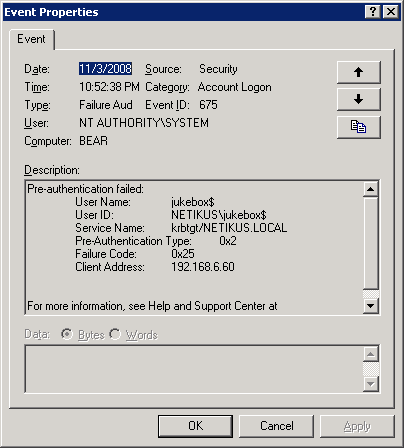
2.91 also includes two more comparison options, file checksums and group membership. So, if an insertion string represents a filename (e.g. from a security event), then EventSentry can create a SHA checksum from the specified file and compare it with the value that you specified. Another example would be a security event that includes a username in an insertion string, in which case you could setup a filter that would only match if that user is a member of particular group you specify. Both examples are mostly applicable for security events, since those are most likely to contain either filenames or usernames.
Using file checksums, you can be notified whenever a user plays solitaire, even when the user renames the executable.

blog_es291_filter_2.pngSimply create a checksum of the file first using shachecksum.exe (included in the free NTToolkit, make sure you account for different OS versions and platforms) and intercept the corresponding 4688 event.

Service Monitoring

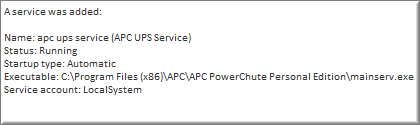
Service Monitoring now collects the username as well as the executable of a service. These additional properties are available in the web reports and in events generated, for example when the username of a service changes.

blog_es291_service_monitoring.pngSoftware Monitoring
Software monitoring has been overhauled in 2.91, and some limitations and bugs have been removed. On Vista, Win2k8 and later, Windows patches are now monitored and included in the software inventory. 64-bit software is now classified as such and searchable, and searching for installed Windows Updated patches has also been simplified.

SNMP Traps
EventSentry can now send version 2c and version 3 traps, previously only version 1 traps were sent by the agent. The SNMP trap daemon was originally set to be released as part of 2.91, but this feature has been pushed back to v2.92.

Web Reporting
We have made a number of improvements in the web reporting to make using our web-based interface easier:

•    Reports are now easily accessible from every page, in addition to the reports p
age.
•    The database usage page now shows the actual page name in addition to the table name.
•    The dashboard page has been overhauled
•    The network status page can be customized (performance counters & disks)

blog_es291_dashboard.pngMiscellaneous Improvements

There have of course been other improvements across the board, such as:

•    Notes can now be applied to computers
•    AD-linked groups can be sorted, and authentication properties can be set globally
•    Hardware monitoring now includes the IP address of an interface
•    Process tracking can capture the command line of a process
•    Logon tracking includes group information
•    File checksum generation has been optimized and will now use fewer CPU resources (affects file monitoring and file access tracking)
•    The minimum database interval for environment monitoring has been reduced to 5 minutes from 15 minutes
•    Software uninstallation events now include the same information as software installation events

If you have an active maintenance agreement, then this 2.91 release will of course be free of charge. If you are not already using EventSentry, then you can download a free 30-day evaluation version from https://www.eventsentry.com/downloads_downloadtrial.php.

Happy Holidays,
Ingmar.

Auditing Changes to Microsoft SQL Server Database Tables

Database servers store massive amounts of data, often including sensitive information. It is not uncommon for there to be databases holding millions of rows of data, where a small subset of rows are considered critical or sensitive. This could be anything from a Social Security number to an EventSentry entry of a security event. Being notified when existing data in your database changes is crucial for log data, and can be accomplished by using triggers with Microsoft SQL Server.

For those of you not familiar with triggers, a database trigger executes code in response to events on a table or database. Triggers are essentially hooks into a table, and they usually execute SQL statements as a response to another SQL statement.

Since we love the windows event log, we’ll take advantage of SQL Server’s ability for triggers to log an event to the event log when a row in a table is modified. This allows us to not only log that activity, but also get notified immediately when suspicious or important activity occurs in the EventSentry database.

In EventSentry, we have a table named ESEventlogMain that stores Windows event information. This table constantly gets new data inserted into it, and it often gets purged as well to manage the size of the database. However, there is no reason this data should ever be modified. If it is, then we know that something is amiss and we want to trigger an event in the event log. It is also useful to know what account made that change.

The first step is to create the message in SQL. You can use this SQL statement to create it:

sp_addmessage 80000, 10, ‘Data Integrity Alert: %s’, @with_log = TRUE

The first argument is a unique SQL server message ID that should be 50001 or higher, you can delete it again using sp_dropmessage. The number 10 is the severity level, but you can read more about the different options for sp_addmessage here.

Now we create the trigger that will use this message:


CREATE TRIGGER Trigger_ESEventlogMain_Modified ON
ESEventlogMain
FOR UPDATE
AS

IF UPDATE(eventmessage) OR UPDATE(eventid) OR UPDATE(eventtime) OR UPDATE(eventcomputer)
BEGIN

     DECLARE @Msg VARCHAR(8000)
     DECLARE @EventNumber INT
     DECLARE @EventID INT
     DECLARE @Computer VARCHAR(255)
     DECLARE @EventMessageOld VARCHAR(8000)
     DECLARE @EventMessageNew VARCHAR(8000)

     SET @EventNumber = (SELECT eventnumber from deleted)
     SET @EventID = (SELECT eventid from deleted)
     SET @Computer = (SELECT A.eventcomputer from ESEventlogComputer as A, deleted as B WHERE A.id = B.eventcomputer)
     SET @EventMessageOld = (SELECT eventmessage from deleted)
     SET @EventMessageNew = (SELECT eventmessage from inserted)

     SET @Msg = ‘ESEventlogMain modified by ‘ + CONVERT(VARCHAR(20), USER_NAME(USER_ID())) + ‘ at ‘ + CONVERT(VARCHAR(20), GETDATE()) + ‘. Computer: ‘ + @Computer + ‘, Event ID: ‘ + CONVERT(VARCHAR(8), @EventID) + ‘, Event Number: ‘ + CONVERT(VARCHAR(16), @EventNumber) + ‘, EventMessage (old) =’ + @EventMessageOld + ‘, EventMessage (new) = ‘ + @EventMessageNew

     RAISERROR( 80000, 10, 1, @Msg)
END

This creates a trigger which will generate an event when the eventmessage column in the ESEventlogMain table is modified. You can remove the “IF UPDATE(eventmessage) …” clause (as well as the BEGIN & END statements) if you want to be notified of any changes to that table, this might however create some noise since acknowledging events will also perform an UPDATE on this table.

FYI: “deleted” and “inserted” are keywords that refer to either the old
record that was updated (=deleted) or the new data (=inserted).

dbtriggers_event.jpgAs you can see from the screen shot above, the message text from a logoff event was renamed to “Trigger Test”. So now that the event is in the event log, we can set up a filter in EventSentry to alert us:

trigger_filter.pngEvents generated from triggers always have the event id 17061, so it’s a good idea to restrict the filter further using the “Content Filter” field. From now on, when the ESEventlogMain table is modified, we will get an entry in the event log as well as an email.
Just remember that any database administrator can delete or modify triggers, so it’s crucial that you keep dba access to your database as restricted as possible.

Please see the Table Relationships topic in the EventSentry help file for more information on the database tables used by EventSentry.

Best,
Tames, Ingmar + Ryan.

Read more

Cleaning up Disk Space and automatic fragmentation reports via email

Even though disk storage is cheaper and faster than ever, for some reason I still run into disk space problems on occasion. The most common disk space problems I run into is a full C drive (why would you need more than 4Gb for the OS?) or a database that grows too large.

We have found and utilized several tools over the past years and I am going to share some of my approaches to quickly identify space hogs, free up disk space and deal with fragmentation.

Once a machine is low on disk space one will usually want to find out which files use up the most space and move them to a new volume or send them to data heaven for good. There are a lot of tools out there that visualize disk space consumption on a volume, but my favorite by far is Windirstat. Windirstat uses a treemap which displays every file in a colored rectangle and was inspired by KDirStat from Linux (the original author really wants to make sure you know what the original is). The size of the rectangle is proportional to the file size, so you will either want to look for clusters of many small files (e.g. to spot lots of unneeded temp files) or for large rectangles to identify any files you might not need anymore. I find it incredibly easy to spot files that can be safely deleted with Windirstat. The screenshot below shows what Windirstat looks like on my Vista laptop with a 64Gb HD.

Windirstat ScreenshotOf course, just running Windirstat alone doesn’t mean that you will be able to find files that can be safely deleted. But once you have identified files that do occupy significant amounts of disk space, you can engage in research to determine whether these files can be compressed, moved or deleted. Usual candidates are the temporary files, pagefile, IIS log files, NTBackup temp files and temporary installer MSI files (more on that below).

Windows will sometimes cache and leave installer files on your C drive, even when the application is no longer installed or has been upgraded. Depending on how long ago the OS was installed, this can be between a few hundred megabytes or nothing at all. You can delete those so-called “orphaned cached Windows Installer data files” with the msizap.exe utility, using the G command-line switch. Using msizap has been the last resort for me a few times, freeing up significant space on the C drive of servers when nothing else could be moved or deleted. Msizap is part of the Windows Installer 4.5 SDK which can be downloaded from http://www.microsoft.com/downloads/details.aspx?FamilyId=6A35AC14-2626-4846-BB51-DDCE49D6FFB6&displaylang=en. The screenshot below shows msizap in action.

Msizap ScreenshotNow, after cleaning up all the space we’d want to defragment our drive as well, right? Disk defragmentation software has been around since MS-DOS, but people are still debating whether defragmentation software, especially commercial one, is worth the effort. It is sort of like taking multivitamins – it most likely doesn’t hurt but there is no clear indicator that it cures diseases or makes you feel better after taking them.

MS-Dos DefragSome operating systems, most notably Linux and Mac OS X attempt to prevent fragmentation as much as possible and don’t even include defragmentation software, but the Windows software market is awash with both free and commercial defrag software. If you are interested in learning more about fragmentation and its cause, then Wikipedia has an article about defragmentation.

So is it worth it to use or invest in commercial defragmentation software? I think it depends. I have used various defragmentation programs over the last 10 years or so, and have seen one case where a MSSQL database on an extremely badly fragmented partition had became so slow that it was essentially unusable (yes, the database was for EventSentry 🙂 ). Defragging this partition with PerfectDisk solved the problem and the database was performing well after defragmentation. So yes, fragmentation can be bad if it gets out of control, though this is the only time I remember a defragmentation having such a significant impact. If you have a partition with little disk space available and lot write activity, then it will probably make sense to continuously defrag the partition to ensure optimal performance. Otherwise I think it is a luxury and will not yield significant disk performance benefits.

You can also use the -a switch of the defrag.exe utility that ships with Windows to analyze a drive and get basic metrics as to whether the drive should be defragmented or not. However, if you have a lot of machines then running defrag.exe on all of them manually can be tedious, especially since you would need to do that on a regular basis (e.g. monthly). Fortunately, you can use EventSentry‘s application scheduler feature to automate this task in three simple steps (in this example we will focus only on the system drive). Since the application scheduler logs output from any command-line utility you run to the event log, we can actually get an email when Windows thinks that a drive is fragmented.

  1. Create an embedded script (e.g. DefragCheck.cmd) that runs “defrag.exe %Systemdrive% -a -v
  2. Create a system health package and add a new application scheduler object to it – making sure that both check boxes in regards to error levels are checked. Pick the embedded script @DefragCheck.cmd and schedule it to run. Everytime defrag.exe is executed, EventSentry will log an event to the event log with the output of defrag.exe.
  3. Create a new event log package and add a filter that matches the events generated (Log=Application, Source=EventSentry, EventID=10200) and additionally looks for the string *You should defragment this volume*.

Voila – now you will get an email every time defrag.exe determines that a drive is fragmented – and only if it’s fragmented.

Defrag.exe is of course only one of the many utilities out there that can determine fragmentation, and you will likely get different results from different utilities. For example, it’s very likely that defrag.exe tells you that a drive is not fragmented, when a different software (e.g. PerfectDisk) will tell you otherwise.

One scenario where you definitely do NOT want to use defragmentation software is on SSD drives, as they usually don’t suffer from the same random access delays and defragging will reduce the lifespan of the drive.

Best,
Ingmar.

EventSentry v2.90: Compliance Tracking for SOX, PCI, GLBA, HIPAA, FISMA, COBIT, …

This is round two in the new features available in EventSentry v2.90, and this time I’ll be covering the new compliance features.

Even though EventSentry was not originally designed to help with compliance, its event log consolidation capabilities made it an effective and economical solution to help our customers with their various compliance efforts throughout the years.

But while being able to filter and search through security events is helpful, it is not enough to quickly create reports that group information based on key elements, such as user creations, group modifications, policy changes and more.

In version 2.90 we addressed this by creating the new Compliance Tracking features which are based on the previous Tracking features.

This means that in addition to the “standard” event log consolidation that simply collects events and records them as is, compliance tracking intercepts specific events (e.g. account creation, logon/logoff, process creation), parses them, extracts the required information and records the relevant information in the EventSentry database.

Compliance Tracking covers the following auditing areas in Windows:

  1. Process Activity
  2. Console & Network Logons
  3. File Access Activity
  4. Account Management (User, Group & Computer accounts)
  5. Policy Changes
  6. Print Jobs

For example, finding out which group memberships changed over the last week is matter of two clicks in the web reports – and restricting a report to only reflect a particular group and/or action is just as easy.

But let me briefly outline the benefits of the individual tracking features:

Process Tracking
This feature records all process activity and lets you know which processes where started when, by whom, for how long and from which computer. This feature is not only useful for security purposes, but also helpful when troubleshooting or requiring statistical information (e.g. how often is PowerPoint being run).

Logon Tracking
This component tracks everything logon-related on your network, including console, successful as well as failed network logons. Using the console logon tracking for example, you can generate reports that show what time users logon and logoff, including from which computer, whether they are local admin and more details. Using the new network logon tracking, you can track successful as well as failed network logons. The included reports can reveal information such as which users logged on with a failed password, logon protocol distribution, most common reason for failed logons and more.

File Access Tracking
This feature is new in v2.90 and tracks all successful file access activity that has been enabled on files or directories. EventSentry does this by intercepting audit events that are generated when files or folders which are being audited. Since Windows Server 2003 and earlier don’t actually audit when objects are changed, but instead only audit the requested file access (click here for a related post), EventSentry can perform additional checks and verifications to complement the native auditing capabilities of the OS – such as checksum creation. Of course EventSentry also gathers additional information – such as the source computer from where a change was made.

Account Management Tracking
Also new in v2.90 is account management tracking, which encompasses user, group and computer account management tracking. This feature really makes life easier when you deal with large quantities of user, group and / or computer account changes.

For example, tracking a users group membership changes – even across computers and domains – is only a few mouse clicks away. Do you need to know which computer accounts were created in the last week in your domain? This only takes three clicks in the web reports.

Policy Change Tracking
Another feature added in v2.90, policy change tracking records the following “policy” events:

  • Domain Policy Changes
  • Audit Policy Changes
  • Kerberos Policy Changes
  • User Right Changes
  • Logon Right Changes
  • Trust Relationship Changes

Again, getting information about any of the above scenarios is extremely easy – such as seeing which user/logon rights were assigned in the last week or on which server the password policy was changed in the last 2 weeks.

Since none of tracking features are limited to hard-coded reports but instead are easily adaptable, they not only make your auditors happy – they provide you with valuable information. This allows you to utilize EventSentry not only for compliance but many other tasks, whether is security-related, for troubleshooting or something else.

As always, please see the documentation for more information. You can take a look at version history as well for a complete list of changes and new features in the 2.90 release of EventSentry.

Enjoy,
Ingmar.

EventSentry v2.90: Event Log Monitoring Changes

Since we have just released EventSentry v2.90, we’ll be blogging about the improvements and new features in the coming weeks. Since event log monitoring is how it all started, my first post in this series will be about the improvements and new features in our event log monitoring engine.

Vista/Windows 2008
The biggest change in v2.90, in regards to event log monitoring, is of course the native support of the Windows Vista and Server 2008 event log API. As many of you know, Microsoft introduced a new API for event log monitoring while still keeping the legacy API in place for applications that don’t support the new API yet.

EventSentry v2.81 uses this legacy API with some work-arounds to monitor the new event logs, but I highly recommend upgrading to v2.90 if you’re monitoring Server 2008 and/or Vista event logs. Upgrading will result in less overhead and better formatting and presentation of events since the agents now access the event log with the native API. Naturally, the event log backup feature will backup event logs in the new evtx format on Vista/Server 2008 computers.

The new version also supports the new Operational event logs which are displayed under Application and Services Logs/Microsoft, for example the Microsoft-Windows-Backup/Operational log.

eventlogblog_290_eventviewer_1.pngThese operational logs need to be configured as custom event logs in EventSentry, by specifying the full path (e.g. Microsoft-Windows-Backup/Operational) as the name of the custom event log.

Please see one of my previous posts about the event log changes in Vista (which also applies to Server 2008) for more information.

Note that support for the new event log API is transparent, and there is still only one executable of the EventSentry agent for all versions of Windows.

64-Bit
EventSentry v2.81 did not format some events on 64-bit editions of Windows correctly, and we have resolved this problem in 2.90 which renders all events on 64-bit machines correctly. The EventSentry agent still runs as a 32-bit application in 2.90, but we have long-term plans to supply a 64-bit agent for x64 operating systems.

Filter Timers
Filter Timer filters allow you to ignore events that would otherwise trigger an alert, if they are followed by another event within a preset time period. For example, if an event indicating that a critical service is stopped is being immediately followed by another event indicating that the service is running again, then a filter would allow you to suppress both events.

Previously however, filter timers had to be setup exactly for each event pair. This meant that if you wanted to use a filter timer for 5 services, then you would have to create 10 events. Starting with 2.90 you only have to create 2 events now, as long as the first event and the clearing event share the same order of insertion strings – which is usually the case.

Please see the documentation for more information.

Action Trigger History
Selected actions (e.g. email, pager) now include the ability to log their trigger history – that is every time they are triggered by an event – to the database. This helps you confirm that a notification was in fact performed, and also gives you the ability to gather statistics about which actions are being triggered and how often.

eventlogblog_290_actiontrigger_1.pngThe action trigger history includes the following information:

•    Date/Time
•    Computer
•    Action Name, Action Recipients
•    Event Log Package, Filter Name
•    Event Log, Event Source, Event ID, Event Number

Please see the documentation for more information.

Web Reports: Error Explanation

Many events from the security event log, for example audit failure event 675, contain error numbers and failure codes inside the event that require you to research them in order to find out what they mean. Here is an example:

eventlogblog_290_event_1.pngYou can see that the failure code of 0x25 in itself doesn’t reveal too much, but if you view the same exact event through our web reporting, then the failure code is automatically explained for you:

eventlogblog_290_event_2.pngAs you can see in the screenshot above, the Kerberos failure code of 0x25 is automatically explained as “Clock skew too great”.

Copying / Pasting event details from Emails
If you have been using EventSentry for a while, then you’ve probably setup event exclusions more than once, most likely after receiving an email from one of the agents. Starting with 2.90, you can now copy the event in your email client and paste it into a new filter. The management console will parse the event properties and automatically fill in the following fields for you:

•    Event Log
•    Event Severity
•    Event Source
•    Event Category
•    Event ID

Please see the documentation for more information.

You can take a look at version history as well for a complete list of changes and new features in the 2.90 release of EventSentry.

Enjoy,
Ingmar.