We are excited to announce the availability of EventSentry v2.93.1, the latest release of our award-winning log, system health and network monitoring solution. This is the first post in a series of articles that will explain the new features and changes of EventSentry v2.93.1 in detail.
This post will provide a high-level overview of the new functionality available in EventSentry, subsequent posts will go into more details on the individual enhancements.
The main new features in EventSentry are:
- Easier setup & deployment with new installer & built-in database
- Vastly improved Performance Monitoring
- Additional packages for performance monitoring
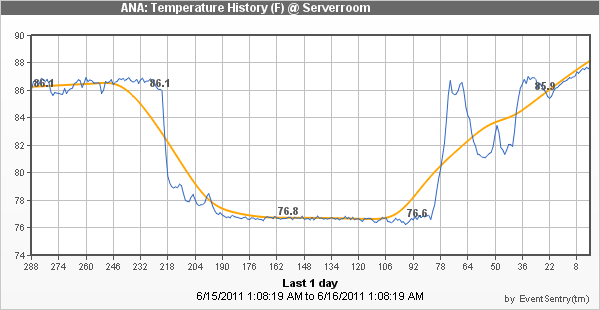
- Support for USB-only temperature/humidity sensors
- Improved hardware inventory for DELL & HP servers
- Warranty expiration information for DELL, HP & IBM servers
- Improved monitoring engine
- Usability enhancements in management console
- Increased throughput for Heartbeat monitoring
Easier setup & deployment with new installer & built-in database
In version 2.93 we switched to a new installer software and added a built-in database to EventSentry. Up until version 2.92, we utilized an MSI-based installer, which turned out to not be a good choice for EventSentry. While MSI is a powerful technology with many benefits, it caused more problems than it solved for us, so we switched to a “traditional” installer. The new installer software allows us to create non-Windows installers as well, something we’re already utilizing in the installation of the next-generation web reports beta.
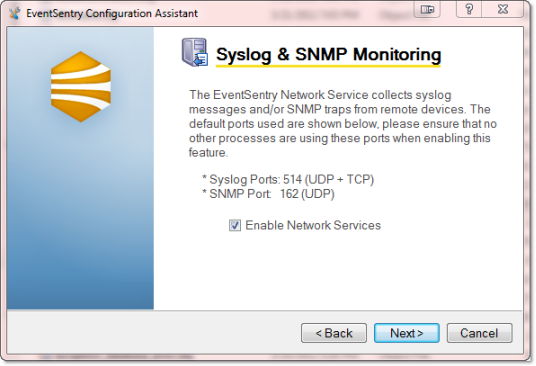
The new installer automates a lot of tasks with IIS (Internet Information Services) which previously needed to be done manually, this results in a much better user experience overall. We also introduced a new “Configuration Assistant”, which configures and upgrades EventSentry components on your behalf.
Another major improvement is the newly added support for PostgreSQL, which is also bundled as an embedded database now. This makes the initial setup of EventSentry significantly easier for users who don’t already have a database setup, or who don’t have much database experience. When selected, the installer sets up an isolated PostgreSQL database instance just for EventSentry, no PostgreSQL knowledge and/or installation is required. If you already have PostgreSQL in your environment, you can utilize an existing database server as well.
Of course we still support other databases as well, including MS SQL Server, MS SQL Server Express, MySQL and Oracle.
For users utilizing a Non-MS-SQL Server database, deployment of agents has been significantly improved. The EventSentry management console now automatically deploys the ODBC drivers for PostgreSQL or MySQL to the remote hosts when a PostgreSQL and/or MySQL database is configured (since Windows only ships SQL Server ODBC drivers by default).
All these improvements combined result in a vastly improved setup and deployment of EventSentry, which will be particularly useful for new installations.
Improved Performance Monitoring
Performance Monitoring has always been one of the most popular features in EventSentry; not surprising since it’s an extremely powerful and flexible feature. We improved the following:
- Alerts now show additional information, including the counter description
- Added support for floating point counters
- Improved the user interface
- Combine two performance counters into a single performance counter
- Added trend detection
- Added automatic alert suppression
- Added wildcard support for instance exclusion
- Added support multiple databases
- Significantly improved the speed of the performance status page
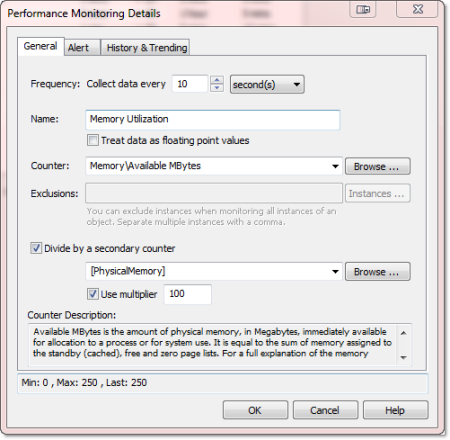
Secondary Counter: Divide a performance counter by a secondary counter, to calculate dynamic performance values that are otherwise not directly available through existing performance counters.
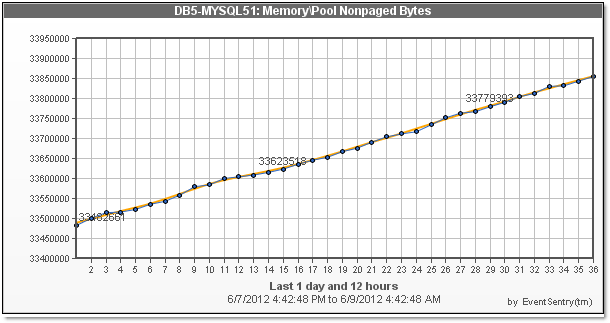
Trend Detection: EventSentry can now attempt to detect leaks in performance counters, especially useful for counters that indicate the current memory or handle count usage of a process (but of course useful for other counters as well). This can help detect problems in early stages, before they cause disruption on the monitored server.
Alert Supression: EventSentry can keep track of historical performance counter values, and can suppress performance alerts if the current counter value matches a pattern. For example, if the CPU usage of a processor is always high on Thursday between 8pm and 10pm, then, after a baseline is established, EventSentry will check the (continously evolving) baseline and suppress alerts.
The user interface has improved, and shows the current counter value of a counter, and also show active instances of a counter (if available), for easier exclusion of those instances.
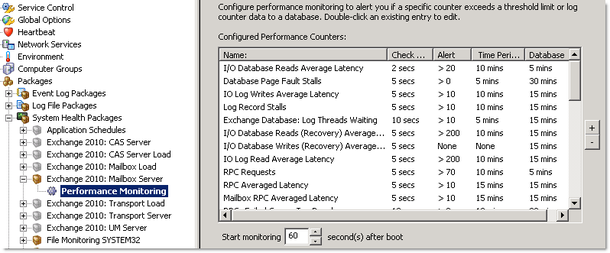
Additional Packages for Performance Monitoring
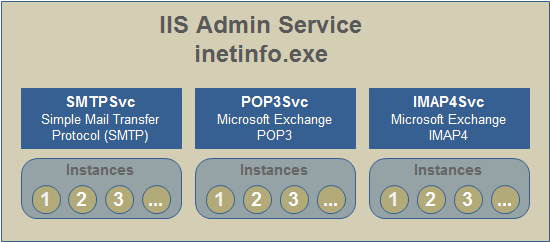
Version 2.93.1 also ships additional system health packages out of the box; templates for Exchange Server, Hyper-V, SQL Server and others help new users setup performance monitoring with just a few clicks. The following default performance monitoring packages are now available:
- Microsoft Exchange Server 2010 (7 packages)
- Microsoft Exchange Server 2003
- .NET
- Active Directory
- ASP.NET
- Hyper-V
- IIS
- Sharepoint
- SQL Server
Part 2 will explain the remaining new features in detail, click here to continue.
 Furthermore, the output can be rather verbose, and will include any logical drive, include CD-ROMs, removable disks and others.
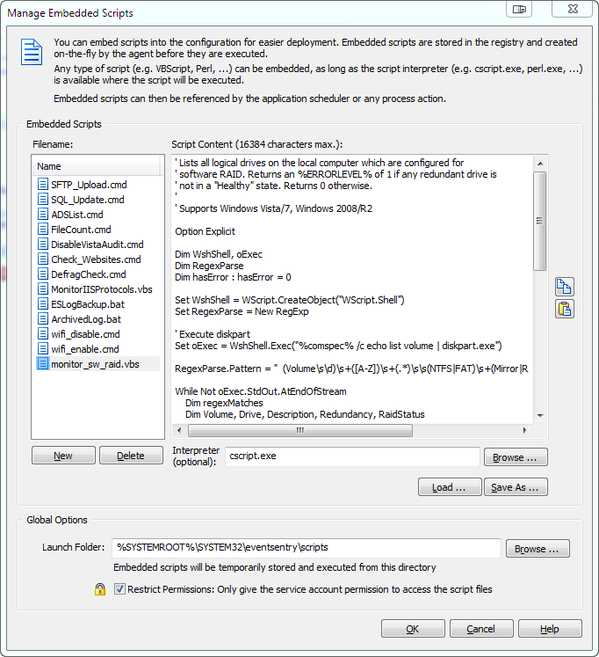 2. Create a new System Health
 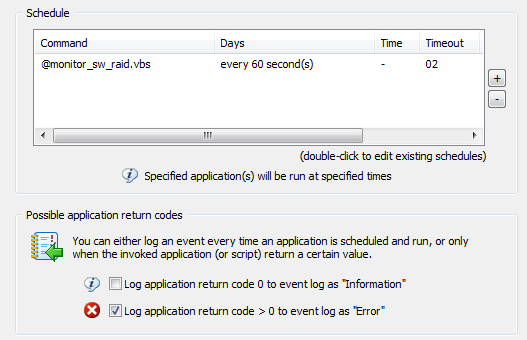 Note that commands starting with the @ symbol are embedded scripts. The “Log application return code 0 to event log …” option is not selected here, since the script runs every minute and would generate 1440 entries per day. You may want to enable this option first to ensure that your configuration is working, or if you don’t mind having that many entries in your application log. It’s mainly a matter of preference.
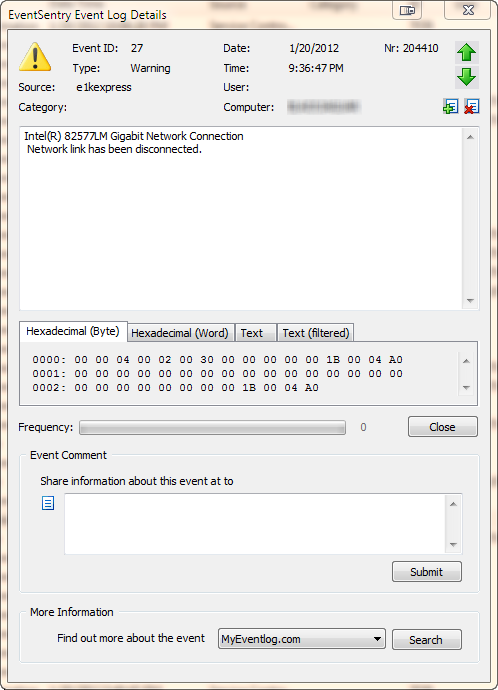 A similar event is logged when the “network link” has connected. The event shown here is specific to the driver of my laptop’s network card (an Intel(R) 82577LM adapter), but most newer drivers will log events when a cable is disconnected or the link is otherwise lost. If you are already running EventSentry with its hardware inventory feature enabled, then you can obtain the name of the network adapter from any monitored host on the network through the hardware inventory page, an example is shown below.
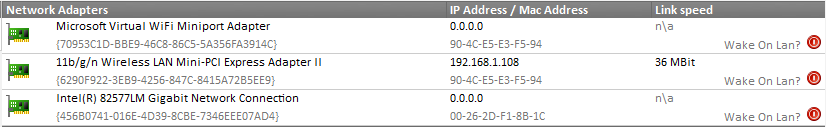 Coming up with a way to enable and disable a particular network connection with netsh.exe was a bit more challenging, but I eventually cracked the cryptic command line parameters of netsh.exe.
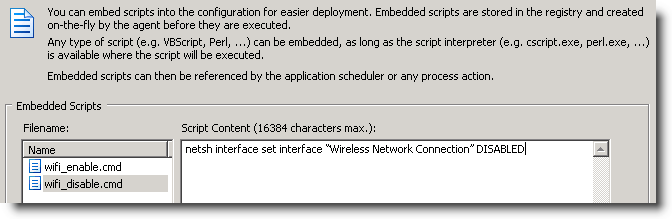 Actions
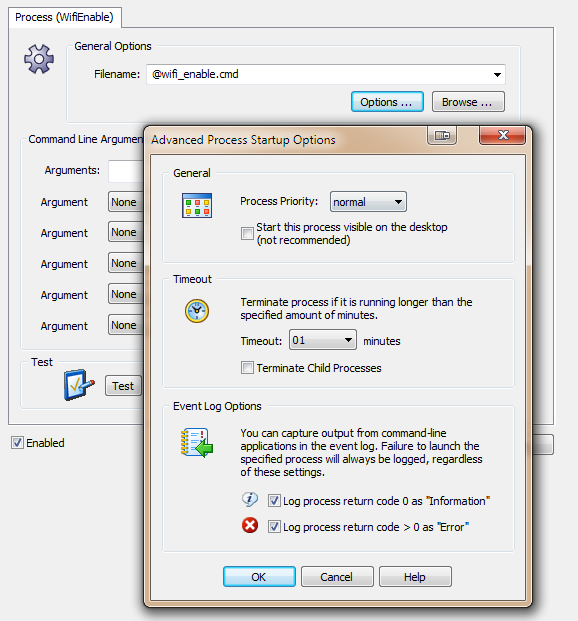 I recommend enabling both “Event Log Options”, as this will help with troubleshooting. Now we just need the event log filters, and we are all set.
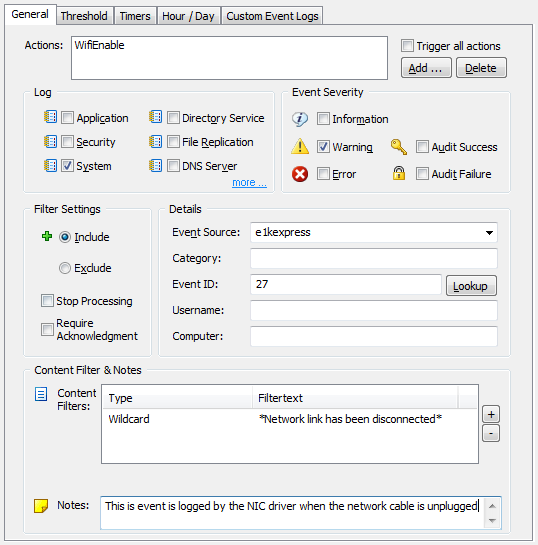 That’s pretty much it. If you enabled the event log options in the process action earlier, then you can see the output from the process action in the event log, as shown below:
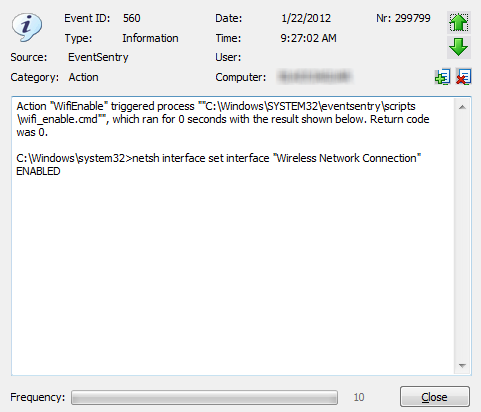 Here are some links to the official EventSentry documentation regarding the features used: