EventSentry v2.92 + iPhone App

EventSentry v2.92
The main new features in version 2.92 are:

  • Network Services component
  • Embedded performance / environment charts
  • HTTP action
  • Hardware Inventory & Monitoring

Please see the release history or the documentation for a complete list of all bug fixes and new features.

Network Services
The network services component is the main new feature in EventSentry, and adds powerful functionality – the ability to receive SNMP traps – to our monitoring solution. Any network device that supports SNMP v1, v2c or v3 can be configured to send traps to EventSentry, which can then either forward the trap details via email, or log them to the database for archival and searching purposes.

Unlike other products, configuring the snmp trap daemon is easy and uncomplicated. Simply specify any MIBs you want to load, configure any SNMP communities and/or v3 users, and (optionally) setup text filters to include/exclude specific traps based on their content.

The network services component now also includes the syslog daemon, which was previously embedded in the EventSentry agent. This change includes higher availability, since the network services will cache incoming (snmp and/or syslog) packets if the main database is temporarily unavailable.

Another new “feature” is the ability to run the network services daemon on Linux and OS X operating systems. We developed all code in the network services to run on multiple platforms, and will continue to do so with all upcoming new components in EventSentry. Cross-platform functionality is still experimental, and as such we don’t currently have an installer for non-Windows operating systems. If you are interested in running the network services daemon on Linux or OS X, then please send a request to our support team.

Visualizing performance and environment data with embedded charts
Performance monitoring and alerts have always been a popular and useful feature in EventSentry, but a numerical alert can only convey so much information. If an alert shows that the CPU usage has been exceeded, say 80% over a time period of 10 minutes, then it is often helpful to see the performance data in a chart. This would show whether the CPU usage spiked during the beginning of the 10-minute interval and is back in an acceptable range, or whether the CPU usage has been mostly constant. In the past, you would need to review the performance history through the web-based reporting (which is still an option and desirable for long-term analysis), but starting with v2.92 email alerts can now include an embedded chart which shows exact performance information from the monitored time interval.

For example, if your performance alert is configured to generate an alert when the CPU usage exceeds 90% for more than 30 minutes, then you can receive an attachment in addition to the text alert, showing performance data from the last 30 minutes.

eventsentry_attachment_performance.pngEmbedded charts are also included with temperature and/or humidity environment alerts, an example chart is shown below:
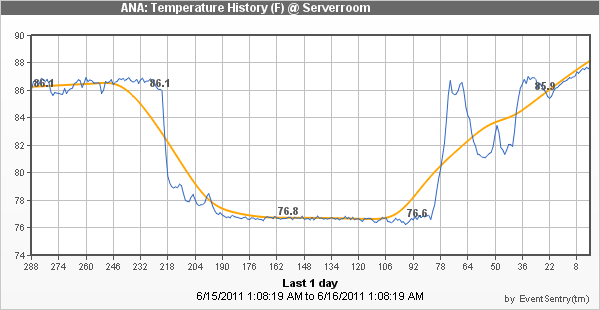
eventsentry_attachment_environment.png

HTTP Action
To better interact with web-based solutions like iService, EventSentry now includes a new notification type: HTTP. With the new HTTP action, you can submit event data to any HTTP or HTTPS-based form, making it extremely easy and reliable to interact with web-based systems (e.g. ticketing systems). Setting up a HTTP action is easy: Simply provide the URL, authentication and specify any event fields that you want to submit.

Hardware Inventory & Monitoring
Also new are network link speed monitoring, which can alert you when the NIC speed changes. This can be useful if a host is accidentally connected to a different switch, or simply to inventory all network connections.

EventSentry also monitors connected USB storage devices and can alert you when a drive is added or removed. The S.M.A.R.T. status of drives is also monitored, and junction points are now taken into consideration when evaluating the disk space of a logical drive. Also new is a “physical disks” section in the web reports.

iPhone App
Why yes, there is an app for that! How convenient would it be to review the health status of all your monitored hosts from your iPhone – including health statistics, hardware details and more?

Dream no more, with the EventSentry iPhone app you can review the status of all your servers from your phone (so long as it has access to your web reports of course).

Upon launch the app shows a searchable list of all monitored hosts and their respective health status. Tapping on a host will show detailed information, such as performance data, hardware information and more. Please take a look at the official iTunes page for the EventSentry app for more information and screenshots.

If you are an Android user then there is no reason to worry, an Android version of the EventSentry Mobile app is planned later this year.

Again, please see the version history for a complete list of features and fixes in v2.92.

Announcing EventSentry v2.91

Now that EventSentry v2.91 has been released, I’m happy to have the opportunity to blog about our monitoring solution again.

The most significant new feature in EventSentry is the Health Matrix, a new way to see your network status in a space-efficient way. In fact, you can see the overall health status of your entire network on a single screen, even if it consists of hundreds of hosts.

We also made numerous other changes throughout the web reports, and added some exciting new filtering capabilities with our event log filters, as well as improved speed with the event log engine and file checksum generations.

EventSentry v2.91 also includes many minor improvements throughout the application, including service monitoring, process tracking and more. We have also updated EventSentry Light, and a new version will be released in the coming days after we have completed testing.

But now to the new features in version 2.91:

Health Matrix
In the health matrix, each host is displayed as a colored square, circle or rectangle, with the color indicating the overall health of the monitored computer. When all of the monitored components of a host are in an OK status, the color of the square is green. The color will change to orange or red when a problem is detected, depending on the number or severity of the issue.

clip0580.pngThe health matrix is highly customizable, for example both the size and shape of the icons can be adjusted depending on the size of the network (and your monitor).

clip0583.pngEvent Log Monitoring
In 2.91, the event log filtering engine was improved, resulting in reduced CPU usage of the event log monitoring component. Since the CPU usage of the EventSentry agent is already quite low, you will most likely only notice this improvement on hosts that generate an extremely large number of events, such as domain controllers.

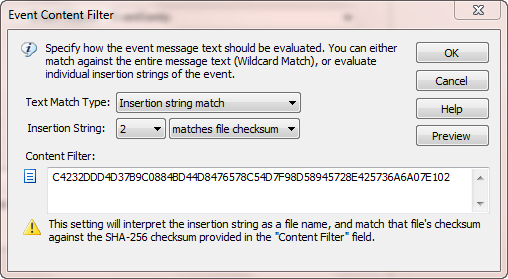
Also new is the ability to filter events based on insertion strings in addition to just filtering based on the event message text. This means that one can now match individual strings inside event messages against strings, numbers, file checksums and group memberships. If you are not familiar with the term “insertion string”, then I highly recommend my previous post about event message files before you read on.

Consider the following hypothetical example: The environment-monitoring component of EventSentry logs event id 10908:

The temperature (78.21 degrees F) has fallen outside the configured range (60F to 76F).

which is defined as:

The temperature (%3 degrees %4) has fallen outside the configured range (%1%4 to %2%4).

This event obviously informs us, that the current temperature has exceeded a set limit. Now let’s say that we wanted to get an email when the temperature exceeds the limit, but also send a page when the temperature exceeds 90 degrees.

The new filtering feature allows you to do just that, by using the numerical comparison functionality with insertion strings (of course you would also need to set the hour/day properties). Assuming that you already have a filter in place for regular email notifications, you would simply setup an additional include filter that would evaluate insertion string 3 (%3) and only match if the number is above 90. See the screen shot below for the example. The result is a filter that only matches when then the temperature exceeds 90 degrees.

blog_es291_filter_1a.png2.91 also includes two more comparison options, file checksums and group membership. So, if an insertion string represents a filename (e.g. from a security event), then EventSentry can create a SHA checksum from the specified file and compare it with the value that you specified. Another example would be a security event that includes a username in an insertion string, in which case you could setup a filter that would only match if that user is a member of particular group you specify. Both examples are mostly applicable for security events, since those are most likely to contain either filenames or usernames.
Using file checksums, you can be notified whenever a user plays solitaire, even when the user renames the executable.

blog_es291_filter_2.pngSimply create a checksum of the file first using shachecksum.exe (included in the free NTToolkit, make sure you account for different OS versions and platforms) and intercept the corresponding 4688 event.

Service Monitoring

Service Monitoring now collects the username as well as the executable of a service. These additional properties are available in the web reports and in events generated, for example when the username of a service changes.

blog_es291_service_monitoring.pngSoftware Monitoring
Software monitoring has been overhauled in 2.91, and some limitations and bugs have been removed. On Vista, Win2k8 and later, Windows patches are now monitored and included in the software inventory. 64-bit software is now classified as such and searchable, and searching for installed Windows Updated patches has also been simplified.

SNMP Traps
EventSentry can now send version 2c and version 3 traps, previously only version 1 traps were sent by the agent. The SNMP trap daemon was originally set to be released as part of 2.91, but this feature has been pushed back to v2.92.

Web Reporting
We have made a number of improvements in the web reporting to make using our web-based interface easier:

•    Reports are now easily accessible from every page, in addition to the reports p
age.
•    The database usage page now shows the actual page name in addition to the table name.
•    The dashboard page has been overhauled
•    The network status page can be customized (performance counters & disks)

blog_es291_dashboard.pngMiscellaneous Improvements

There have of course been other improvements across the board, such as:

•    Notes can now be applied to computers
•    AD-linked groups can be sorted, and authentication properties can be set globally
•    Hardware monitoring now includes the IP address of an interface
•    Process tracking can capture the command line of a process
•    Logon tracking includes group information
•    File checksum generation has been optimized and will now use fewer CPU resources (affects file monitoring and file access tracking)
•    The minimum database interval for environment monitoring has been reduced to 5 minutes from 15 minutes
•    Software uninstallation events now include the same information as software installation events

If you have an active maintenance agreement, then this 2.91 release will of course be free of charge. If you are not already using EventSentry, then you can download a free 30-day evaluation version from https://www.eventsentry.com/downloads_downloadtrial.php.

Happy Holidays,
Ingmar.

Announcing AutoAdministrator v2.0

After launching version 2.90 of EventSentry just a few months ago, we’re excited to announce yet another major software release coming from NETIKUS.NET ltdAutoAdministrator v2.0.

The last update of the 1.x series was released more than four years ago, so we decided to completely re-build it from scratch and add all the features that have been requested by our users since the last release. The result is a powerful tool that makes it unbelievably easy to apply changes to remote workstations and servers. Whether a change or query needs to be applied to one or 100 computers makes little difference with AutoAdministrator.

In a nutshell, AutoAdministrator lets you query or update a variety of Windows settings and services across any number of servers and/or workstations, without the need to create a script or perform the actions manually. Simply select the feature, computers (it integrates with Active Directory) and click start.

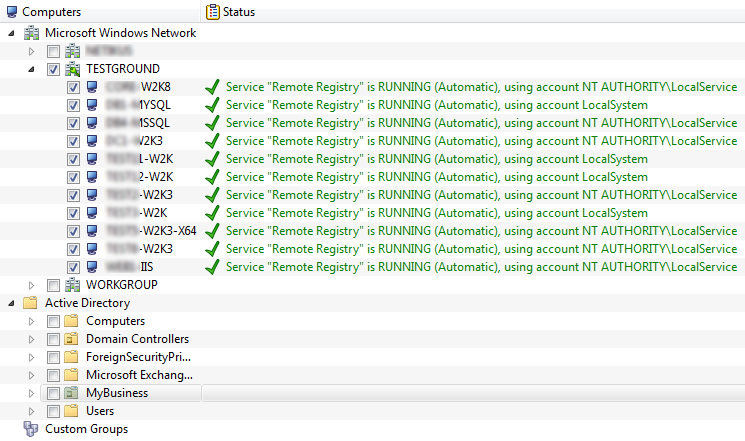
Let’s say, for example, that you needed to obtain or set the value of a registry entry across 30 machines. By just using regedit, it would probably take you a total of 15 minutes to connect, retrieve the value, and paste it to an editor/spreadsheet and move on to the next machine. The same task, using AutoAdministrator, could be done in as little as 1 minute.

aa_v20_1.jpg

Querying the “Remote Registry” service status across multiple computers

This is just one example of course, as AutoAdministrator can control services, read/set registry values, query file information, copy/delete files, manage passwords, shutdown/reboot, query logged on users, ping hosts and manage ODBC connections.

As previously mentioned, AutoAdministrator integrates with ActiveDirectory, making it a breeze to manage computers that are part of a Windows domain. You can also pull computers from the Microsoft Windows Network or create custom groups to organize computers inside AutoAdministrator. If you need to connect to remote computers using alternate (administrative) credentials, then you can assign those credentials to any Active Directory OU, group or individual computer item.

The update process itself is fully threaded, making it possible to push updates in a very short time, even to a large amount of computers.

aa_v20_2.jpg

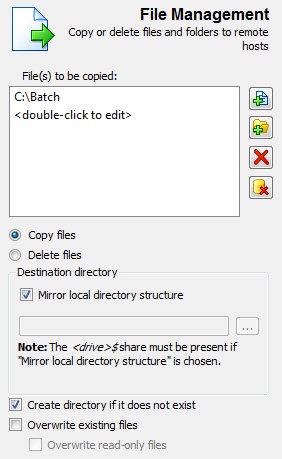
File Management dialog, mirror / copy the
C:\Batch directory to remote computers


Another new feature is the ability to create presets, making it a snap to repeat common tasks. Simply configure the feature (e.g. query service W3SVC), select the computers and save it as a preset. The next time you open AutoAdministrator, you can simply select the preset and click “Update”.

We think that AutoAdministrator is an incredible time-saver for anybody who manages more than 10 computers, whether they are servers or workstations.

Here is a complete list of all features in the new AutoAdministrator:

Ping
Ping computers to retrieve ping statistics.

ODBC
Query, copy or delete System DSNs on remote hosts.

Passwords
Verify, update or reset passwords of user accounts on remote hosts.

Shutdown / Reboot

Shutdown, reboot or cancel a pending shutdown on remote hosts. You can optionally send a message as well.

Services

  • Control any service (Query, start, stop, continue, pause, restart)
  • Change startup type (manual, automatic, disabled)
  • Remove service
  • Change Logon (service can be automatically restarted as well)


Registry

  • Values: Read, add, delete and change
  • Keys: Add, delete
  • Copy entire keys to remote computers

File Management

  • Copy files and folders to remote computers
  • Delete files and folders from remote computers
  • Mirror local directories to remote computers

File Information

  • Query remote files to retrieve its hash, size, attributes, modification time, version, company or description
  • Remote files can be compared against a hash you provide

Logons

  • Show users that are currently logged on interactively to a computer
  • Count the number of users that are logged on (useful for terminal servers)

The scheduled release date for AutoAdministrator is January 12th 2009, and you can request a trial then at https://www.netikus.net/products_trial_request.html. If you can’t wait and would like to download the beta, then simply contact our support team at https://www.netikus.net/about_contact.html.

Happy New Year,
Ingmar.

EventSentry v2.90: Compliance Tracking for SOX, PCI, GLBA, HIPAA, FISMA, COBIT, …

This is round two in the new features available in EventSentry v2.90, and this time I’ll be covering the new compliance features.

Even though EventSentry was not originally designed to help with compliance, its event log consolidation capabilities made it an effective and economical solution to help our customers with their various compliance efforts throughout the years.

But while being able to filter and search through security events is helpful, it is not enough to quickly create reports that group information based on key elements, such as user creations, group modifications, policy changes and more.

In version 2.90 we addressed this by creating the new Compliance Tracking features which are based on the previous Tracking features.

This means that in addition to the “standard” event log consolidation that simply collects events and records them as is, compliance tracking intercepts specific events (e.g. account creation, logon/logoff, process creation), parses them, extracts the required information and records the relevant information in the EventSentry database.

Compliance Tracking covers the following auditing areas in Windows:

  1. Process Activity
  2. Console & Network Logons
  3. File Access Activity
  4. Account Management (User, Group & Computer accounts)
  5. Policy Changes
  6. Print Jobs

For example, finding out which group memberships changed over the last week is matter of two clicks in the web reports – and restricting a report to only reflect a particular group and/or action is just as easy.

But let me briefly outline the benefits of the individual tracking features:

Process Tracking
This feature records all process activity and lets you know which processes where started when, by whom, for how long and from which computer. This feature is not only useful for security purposes, but also helpful when troubleshooting or requiring statistical information (e.g. how often is PowerPoint being run).

Logon Tracking
This component tracks everything logon-related on your network, including console, successful as well as failed network logons. Using the console logon tracking for example, you can generate reports that show what time users logon and logoff, including from which computer, whether they are local admin and more details. Using the new network logon tracking, you can track successful as well as failed network logons. The included reports can reveal information such as which users logged on with a failed password, logon protocol distribution, most common reason for failed logons and more.

File Access Tracking
This feature is new in v2.90 and tracks all successful file access activity that has been enabled on files or directories. EventSentry does this by intercepting audit events that are generated when files or folders which are being audited. Since Windows Server 2003 and earlier don’t actually audit when objects are changed, but instead only audit the requested file access (click here for a related post), EventSentry can perform additional checks and verifications to complement the native auditing capabilities of the OS – such as checksum creation. Of course EventSentry also gathers additional information – such as the source computer from where a change was made.

Account Management Tracking
Also new in v2.90 is account management tracking, which encompasses user, group and computer account management tracking. This feature really makes life easier when you deal with large quantities of user, group and / or computer account changes.

For example, tracking a users group membership changes – even across computers and domains – is only a few mouse clicks away. Do you need to know which computer accounts were created in the last week in your domain? This only takes three clicks in the web reports.

Policy Change Tracking
Another feature added in v2.90, policy change tracking records the following “policy” events:

  • Domain Policy Changes
  • Audit Policy Changes
  • Kerberos Policy Changes
  • User Right Changes
  • Logon Right Changes
  • Trust Relationship Changes

Again, getting information about any of the above scenarios is extremely easy – such as seeing which user/logon rights were assigned in the last week or on which server the password policy was changed in the last 2 weeks.

Since none of tracking features are limited to hard-coded reports but instead are easily adaptable, they not only make your auditors happy – they provide you with valuable information. This allows you to utilize EventSentry not only for compliance but many other tasks, whether is security-related, for troubleshooting or something else.

As always, please see the documentation for more information. You can take a look at version history as well for a complete list of changes and new features in the 2.90 release of EventSentry.

Enjoy,
Ingmar.

Gateway IP Monitor Update with DynDNS update feature

I’m happy to briefly announce the release of Gateway IP Monitor v1.40 which includes the ability to update a DynDNS host name. We received many feature requests over the last few months, and the ability to update a DynDNS host name was probably the most important one. This feature has been on the list for quite some time, and we finally got around to adding it.

We also cleaned up the user interface (we now have icons!), fixed a few bugs and added the ability to customize the email message.

Remember that Gateway IP Monitor runs as a service and can perform a variety of actions upon an IP address change:

  • Sends an email (SSL support)
  • Updates a DynDNS host name
  • Executes a program
  • Logs the IP address to a file

Remember that we offer support for Gateway IP Monitor through our forums, and please do send us feedback.

Enjoy!