This is the second and last article about the new features in the EventSentry 2.93.1 release, part 1 can be found here.
Support for USB-only temperature/humidity sensors
Up until v2.92, all environment sensors supported by EventSentry required a serial port to work; the USB connector is used only for drawing power. Starting with v2.93.1, EventSentry now supports a USB-only temperature & humidity sensor (#30602), and a serial port is no longer required (water, smoke & motion sensors still require a serial port – for now).
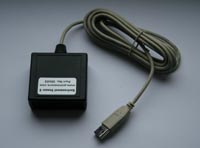
The new USB-only environment sensor requires virtual COM port drivers from FTDI to be installed before it can be used. These (certified) drivers will create a virtual COM port on the computer, through which EventSentry will communicate with the sensor. The drivers ship with EventSentry, and are automatically installed by the management console when a USB-only sensor is configured. The driver installation does not require a reboot.
Improved hardware inventory for DELL & HP servers
EventSentry has always provided a solid hardware inventory which included installed memory (and available slots), network adapters, disks, disk controllers, graphics adapter and more. Server specific information was only available through the manufacturers management tools such as DELL OpenManage. EventSentry would always relay alerts about critical issues (e.g. degraded RAID, failed redundant power supply, etc.), but status information (does the server have redundant power supplies?) was not available through the EventSentry web reports.
Version 2.93.1 changes this, and EventSentry now shows the following hardware details on HP© and DELL© servers, provided that the management tools (e.g. DELL© OpenManage) are installed:
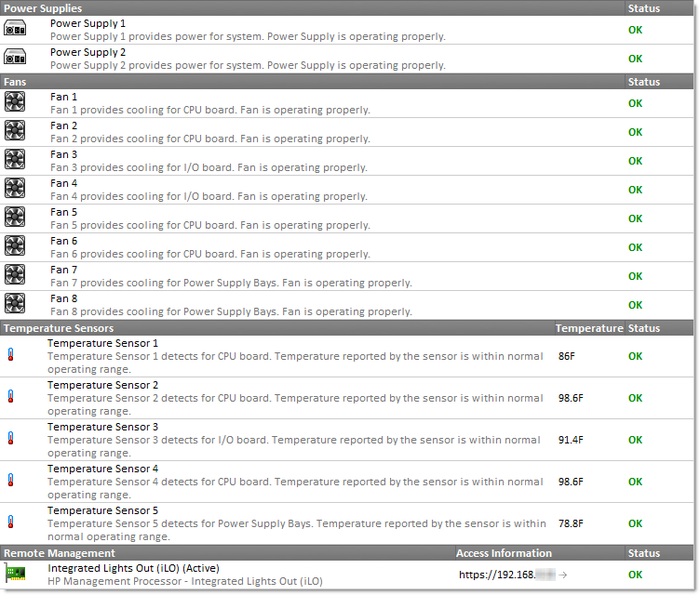
- Installed power supplies and their status
- Installed fans and their status & speed
- Installed temperature sensors and current temperature
- Installed remote access cards (e.g. iLO or DRAC) and their IP address
- Installed RAID controllers and configured logical drives
- Installed hard disks
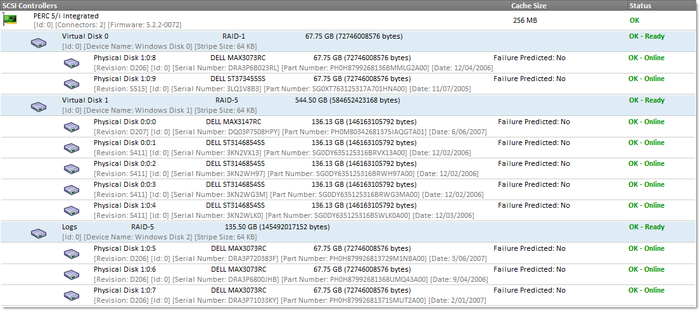
The images above and below show how incredibly easy it is to see all hardware components of a server – on ONE screen, including all configured RAIDs and their associated physical drives – something Windows itself will not show you.
Most of these new properties are searchable as well, so it’s easy to list servers with more than one power supply, servers with remote access cards, RAID and so forth.
In addition, the Network Overview page will show you any hardware components from your entire network that are not in an OK state, whether it’s a hard disk, fan, PSU or temperature sensor.
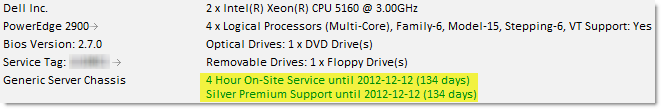
Warranty expiration information for DELL, HP & IBM servers
Also new as part of the hardware inventory is the ability to view when a maintenance/support contract for a server or workstation will expire. When viewing the hardware inventory of a host, EventSentry will show you all available support contracts and their expiration date.
Improved Monitoring Engine
The core event log monitoring engine in the EventSentry agent has been tweaked to allow for higher throughput and lower CPU utilization, especially for Windows 2008 and later operating systems. Systems generating a large amount of events (such as domain controllers) should benefit from this enhancement.
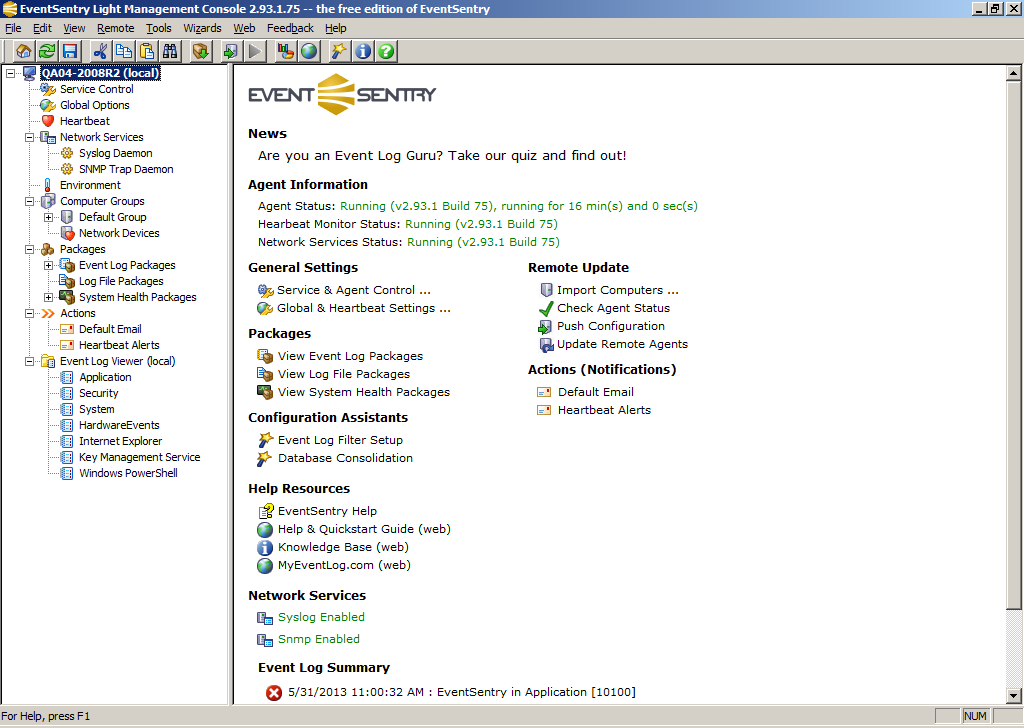
Usability enhancements in management console
We improved two key areas in the management console for better usability: Speed when saving and keyboard navigation. Up until v2.92, saving the configuration in the management console could take more than 10 seconds, especially when the configuration contained a comprehensive ruleset. Starting with v2.93.1, only objects which were changed are written to disk; saving the configuration now only takes 1-2 seconds in most cases.
Also added was better keyboard navigation, especially for navigating the tree in the left pane. You can now navigate through the key by simply typing the name of a package, filter, action or other object. The improved keyboard navigation also allows you to use the scroll wheel of your mouse to quickly scroll through the tree.
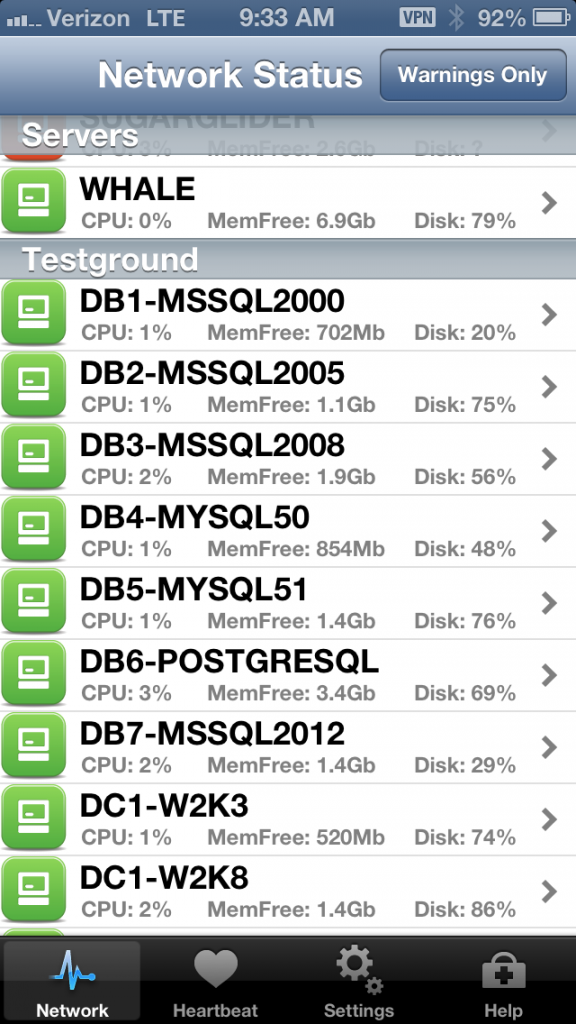
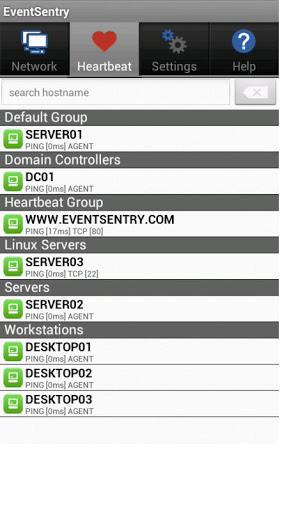
Increased throughput for Heartbeat Monitoring
The heartbeat agent has been improved and can now scan remote hosts in parallel using threads. Even monitoring hundreds of hosts can be performed in a matter of seconds, so that a networking problem is reported as soon as possible. You can specify how many threads the heartbeat agent should use, or have the agent automatically allocate threads as needed based on the number of hosts and the network speed. Simply set the monitoring interval (e.g. 30 seconds) and EventSentry will do the rest!
Other noteworthy improvements
On hosts running Vista and later, the hardware inventory now retrieves the configured UAC level, which is also searchable, making it easy to find hosts with insufficient UAC settings. Process tracking also captures the current process elevation level, making it again easy to find processes which are running elevated (“Run as Administrator”).
Event Log filters can now search event details with a (perl-based) regular expression engine, time-based restriction can be set to the “nth” day of a month – ideal for creating filters based on “Patch Tuesday” for example. The same “nth” day of the month option is also available for heartbeat maintenance schedules by the way.
The environment dialog in the management console now shows descriptions with serial ports, making it easier to select the correct COM port. The management console also polls the status of all three EventSentry services in the background, and updates the status icons accordingly if a service is not running.
The web reports were tweaked, and many pages now load significantly faster, in particular the performance status page. The load speed of many other pages has also been improved if the “resolve hostname” option is enabled in the profile editor. Furthermore, on x64 systems, IIS no longer has to run in 32-bit mode.
Alerts generated after event log backups are more verbose, and include a SHA-256 checksum of the created backup file for tamper detection.
Finally, EventSentry v2.93.1 includes preliminary support for both Windows 8 and Server 2012.
Please see the release history for a complete list of all new features and bug fixes. Contact us with any questions about EventSentry and/or the v2.93.1 release.