I recently read an article in the Hackin9 magazine (worth taking a look if you haven’t heard about it) about alternate data streams (ADS) in NTFS. I had heard about this hidden feature in NTFS a long time ago actually, but over the years forgot about its existence again.
Background
In a nutshell, the NTFS file system, which was introduced with Windows NT 3.1, supports ADS – sometimes also referred to as “hidden streams”. This means that you can attach or associate any number of files to an existing file, yet those files will not be visible to the vast majority of file management applications – including explorer and the “dir” command (Vista can show ADS with a parameter). One thing I find interesting about streams is that a lot of people in IT do not seem to
know about them, even people otherwise very familiar with the Windows
Operating System.
Now, streams are created and accessed by appending the “host” file name with a colon, followed by the name of the stream. Let’s say you want to create a text file called financials.txt and hide it with winhelp.exe, you would run notepad C:\Windows\winhelp.exe:financials.txt. This will bring up notepad which will prompt you to create the file since it doesn’t exist (since the alternate stream is basically a file). You can then save any text in the hidden file and save it. You will notice that the file you just created will not show up when you do a directory list (dir C:\Windows) and will also not show up in the Windows Explorer. Note that the timestamp of the host file will change however.
Now there are of course a variety of utilities that have been developed in the last 15 (!) years that will allow you to find hidden streams, but more on that later. Hidden streams still exist on Vista and later, though the feature seems to have become more restrictive.
There are apparently no limits as to how many streams one can associate with a file, or the type of file that can be associated. This means that you can associate an executable as much as you can an ASCII file. There are however some limitations as to how user mode applications (e.g. notepad) can access hidden streams. Let’s go back to the previous example where we created the file financials.txt in winhelp.exe. If you open a command prompt and execute type C:\Windows\winhelp.exe:financials.txt, then you will not be able to see the contents of the hidden file. If you use notepad instead however, you will be able to see the file (notepad C:\Windows\winhelp.exe:financials.txt). This is probably because cmd.exe and its built-in commands up until Windows XP are not aware of alternate streams. ON a Windows XP machine I also could not open that same file if I tried to open it from inside notepad with the File -> Open command.
Creating Streams
Things get more interesting when you attach executables to files – and execute them! Let’s say I wanted to hide popular windows game solitaire inside the file C:\Windows\wganotify.log and call the stream “calc.exe”. Here is what you do:
type system32\sol.exe > C:\Windows\WgaNotify.log:calc.exe
start C:\windows\WgaNotify.log:calc.exe
Auditing Alternate Data Streams
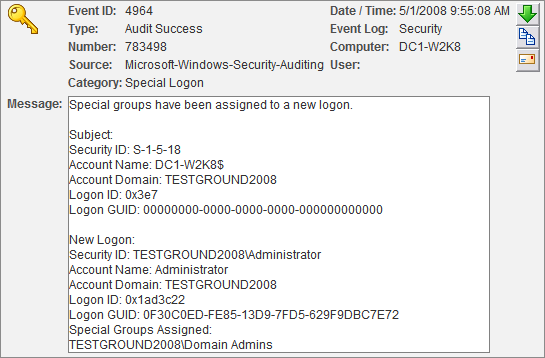
Those of you interested in auditing will probably wonder how Windows tracks access to hidden streams in the event log. Well, there is good and bad news. The bad news is that object tracking (the famous event 560) does not show hidden streams, and instead only shows the “host” file name being accessed. Process Tracking on the other hand shows hidden streams in the expected manner. For the above example, a 592 event will show that file C:\windows\WgaNotify.log:calc.exe was executed.
Exploiting Streams
Scary, huh? This opens up a can of worms when you think about malware hiding inside otherwise innocent files – such as a log file. At appears as if most AntiVirus products do not detect hidden streams, at the same time there doesn’t seems to be a significant number of mainstream malware applications out there are that rely on hidden streams. I’m not sure why that is, since this feature seems almost too good to be true for the writer of any malicious applications. One reason might be that malware writers mostly target home machines, and many of those computers are still formatted with the FAT(32) file system, which of course doesn’t support ADS. This might change over time though, as more (home) computers use NTFS as their file system.
So after reading up on ADS, playing around with it last week, scanning my computer for hidden streams, I arrived at the inevitable question: What is the higher purpose of Alternate Data Streams? I mean, many applications don’t support it, most people don’t know about it, and a scan didn’t reveal any hidden streams besides a couple inside some Microsoft installers that apparently use them as some sort of meta data.
As it turns out, ADS was created for compatibility with the Macintosh HFS file system, which uses a data fork and resource fork to store data in a file (OS X now uses the HFS+ file system). But over the years (it’s been 15 after all) some developers at Microsoft decided to utilize this feature. For example, when you specify summary information about a file (right-click -> properties -> summary), then this information will be stored in ADS.
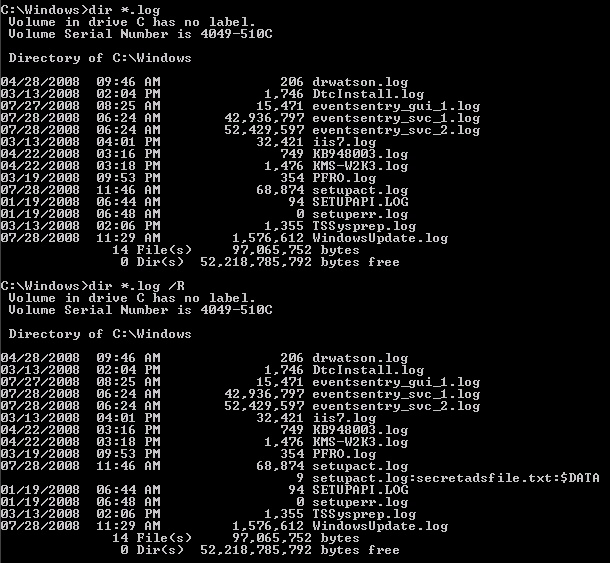
As mentioned earlier, there have been some improvements in regards to ADS with Vista and later. Vista can now show alternate streams with the /R switch of the “dir” command. My preliminary research also shows that hidden streams can no longer be executed in Vista or later – so what we did in the above example will not work. I think that’s a good thing, since there really is no practical reason (unless you develop malware) to do this. The screen shot below shows the output of a regular dir command and the dir /R command on a Windows 2008 server (note the file setupact.log).
 In my humble opinion, Microsoft should get rid of alternate streams in future versions of Windows, and instead come up with some sort of structured way of embedding meta data in files. Anything contained in meta data should be non-executable and limited in size, e.g. 256kb.
Discovering Streams
So what does all this mean for you, the person responsible for security in your network? How can you find hidden streams and detect if streams are being added to files?
There are many free third-party utilities out there that show and manipulate hidden streams, but the discovery of this feature led us to extend the functionality of the File Monitoring feature of EventSentry to include the automatic detection of hidden streams in real-time. This means that any stream added, modified or removed from a file in a monitored location will be detected by EventSentry.
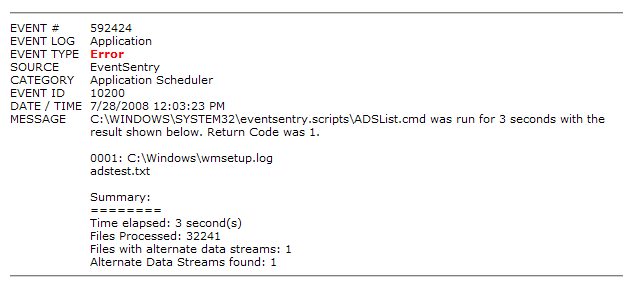
We have also developed a new command-line tool, adslist.exe, that will list all alternate data streams on a directory and optionally its sub directories. The tool is part of the NTToolkit v1.96 and I recommend that you schedule to run this tool with the Application Scheduler feature of EventSentry on a regular basis, or schedule it with the Windows Task Scheduler and email the results (adslist.exe C:\ /s). The advantage of using EventSentry is that the results of adslist.exe can automatically be emailed to you only if alternate streams were found. You can do this because the %ERRORLEVEL% is set to 1 by adslist.exe when one or more streams are found. The screenshot below shows what this would look like in the email sent by EventSentry:
 Manipulating Streams
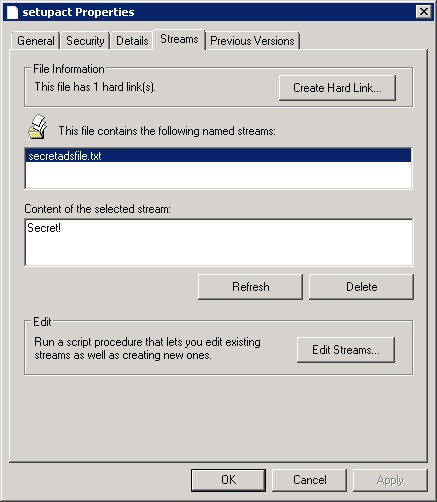
While Microsoft doesn’t offer a tool to search for and discover alternate data streams, they do offer a good explorer-extension that allows you to view and delete alternate data streams. You can download it from https://docs.microsoft.com/en-us/sysinternals/downloads/streams, the zip file contains the source code as well as another utility to create hard links on NTFS volumes. After extracting the archive, navigate to the \StrmExt\ReleaseMinDependency folder and run regsvr32 StrmExt.dll. You will then have an additional tab when viewing file properties in explorer called “Streams”:
 Another way to get rid of hidden streams is to copy a file to a FAT[32] volume and then back to the NTFS volume, or – if you don’t have a FAT[32] volume available – simply compress and uncompress the file again.
Well, I hope this gives you a better understanding of alternate data streams, even if you were already familiar with them. Like I mentioned earlier, it doesn’t appear as if ADS is used for evil in a large scale quite yet (so no reason to panic!), but I believe it is better to be safe than sorry.
