Since we have just released EventSentry v2.90, we’ll be blogging about the improvements and new features in the coming weeks. Since event log monitoring is how it all started, my first post in this series will be about the improvements and new features in our event log monitoring engine.
Vista/Windows 2008
The biggest change in v2.90, in regards to event log monitoring, is of course the native support of the Windows Vista and Server 2008 event log API. As many of you know, Microsoft introduced a new API for event log monitoring while still keeping the legacy API in place for applications that don’t support the new API yet.
EventSentry v2.81 uses this legacy API with some work-arounds to monitor the new event logs, but I highly recommend upgrading to v2.90 if you’re monitoring Server 2008 and/or Vista event logs. Upgrading will result in less overhead and better formatting and presentation of events since the agents now access the event log with the native API. Naturally, the event log backup feature will backup event logs in the new evtx format on Vista/Server 2008 computers.
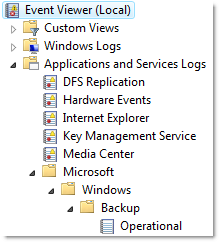
The new version also supports the new Operational event logs which are displayed under Application and Services Logs/Microsoft, for example the Microsoft-Windows-Backup/Operational log.
 These operational logs need to be configured as custom event logs in EventSentry, by specifying the full path (e.g. Microsoft-Windows-Backup/Operational) as the name of the custom event log.
Please see one of my previous posts about the event log changes in Vista (which also applies to Server 2008) for more information.
Note that support for the new event log API is transparent, and there is still only one executable of the EventSentry agent for all versions of Windows.
64-Bit
EventSentry v2.81 did not format some events on 64-bit editions of Windows correctly, and we have resolved this problem in 2.90 which renders all events on 64-bit machines correctly. The EventSentry agent still runs as a 32-bit application in 2.90, but we have long-term plans to supply a 64-bit agent for x64 operating systems.
Filter Timers
Filter Timer filters allow you to ignore events that would otherwise trigger an alert, if they are followed by another event within a preset time period. For example, if an event indicating that a critical service is stopped is being immediately followed by another event indicating that the service is running again, then a filter would allow you to suppress both events.
Previously however, filter timers had to be setup exactly for each event pair. This meant that if you wanted to use a filter timer for 5 services, then you would have to create 10 events. Starting with 2.90 you only have to create 2 events now, as long as the first event and the clearing event share the same order of insertion strings – which is usually the case.
Please see the documentation for more information.
Action Trigger History
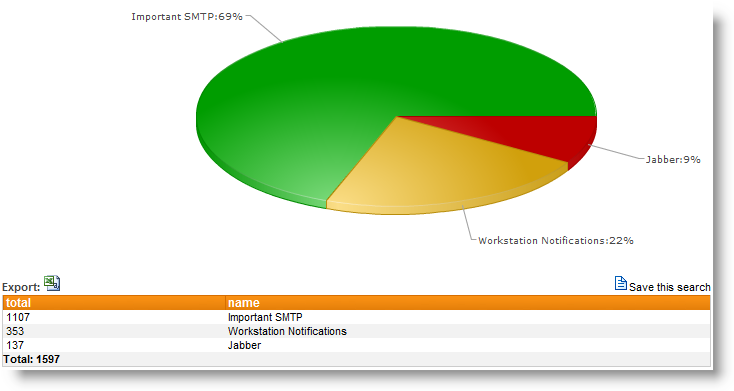
Selected actions (e.g. email, pager) now include the ability to log their trigger history – that is every time they are triggered by an event – to the database. This helps you confirm that a notification was in fact performed, and also gives you the ability to gather statistics about which actions are being triggered and how often.
 The action trigger history includes the following information:
• Date/Time
• Computer
• Action Name, Action Recipients
• Event Log Package, Filter Name
• Event Log, Event Source, Event ID, Event Number
Please see the documentation for more information.
Web Reports: Error Explanation
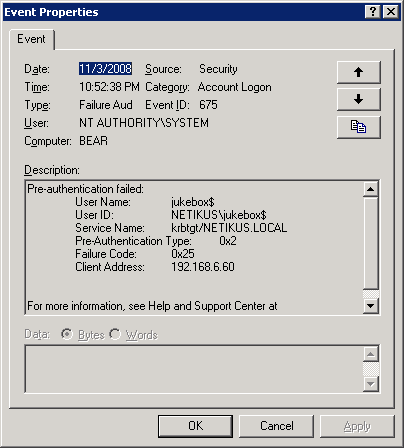
Many events from the security event log, for example audit failure event 675, contain error numbers and failure codes inside the event that require you to research them in order to find out what they mean. Here is an example:
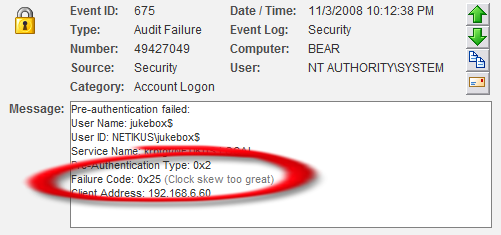
 You can see that the failure code of 0x25 in itself doesn’t reveal too much, but if you view the same exact event through our web reporting, then the failure code is automatically explained for you:
 As you can see in the screenshot above, the Kerberos failure code of 0x25 is automatically explained as “Clock skew too great”.
Copying / Pasting event details from Emails
If you have been using EventSentry for a while, then you’ve probably setup event exclusions more than once, most likely after receiving an email from one of the agents. Starting with 2.90, you can now copy the event in your email client and paste it into a new filter. The management console will parse the event properties and automatically fill in the following fields for you:
• Event Log
• Event Severity
• Event Source
• Event Category
• Event ID
Please see the documentation for more information.
You can take a look at version history as well for a complete list of changes and new features in the 2.90 release of EventSentry.
Enjoy,
Ingmar.
hi, thanks for your article and precisions,regards.
Good day, thank you for posting articles about new things and ideas. I read some more your posts and they are very helpful.
Thanks for a good explanation of the changes in 2.90 concerning event log monitoring. It’s much more convenient now
I was very pleased to find this site.I wanted to thank you for this great read I definitely enjoying every little bit of it and I have you bookmarked to check out new stuff you post.
price of silver today per ounce