Everybody wants to have a more secure network – and everybody has various tools at their disposal to at least improve the security of their network. But which tool is the best for the job, and where do you start? The answer to this question is somewhat easier (and more structured) for organizations that have to adhere to compliance frameworks (ISO, CMMC, PCI, SOC, …), but a little harder for business that have no such requirements.
EventSentry has long included many tools to increase the security of your network, and in the latest 5.1.1.104 update we made it significantly easier to increase the security of your infrastructure with 3 new dashboards:
The security dashboards will guide you through the process of:
- Ensuring your audit settings are correct
- Identifying insecure settings on your network
- Illustrating significant changes that should be reviewed
So how do you get started? After applying the latest patch, head over to the web reports and load any dashboard and hit the SPACE bar – the new security dashboards will show up in the list and you can import them there.
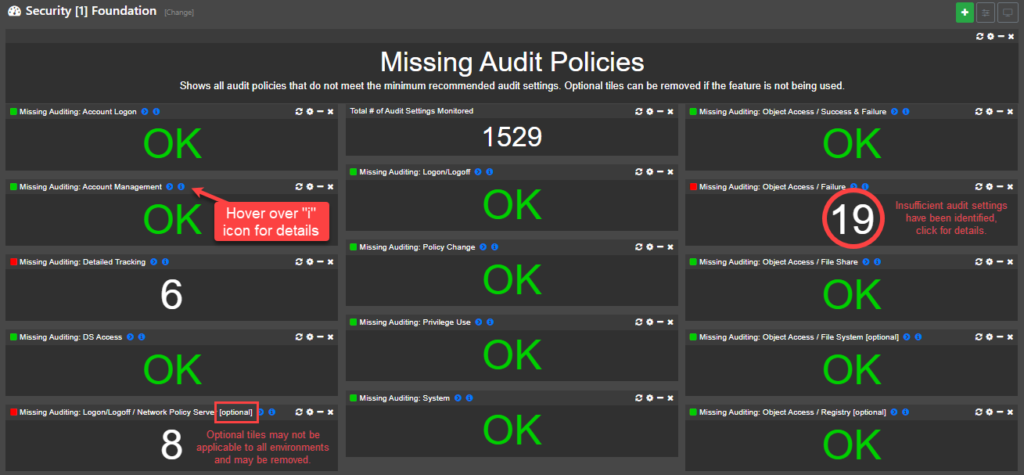
After the dashboards are imported, click on the Dashboard in the menu and select the first one: “Dashboard [1] Foundation”. This dashboard simply evaluates all of your audit policies to make sure they are adequate. Proper auditing is crucial, and is the foundation for many other monitoring initiatives.

Important: You can click on the header of each imported dashboard to navigate to a KB article, which explains the purpose of the dashboard in detail and how to resolve any identified issues.
It’s recommended to configure audit settings via group policy, to ensure that settings are always enforced and apply network-wide. You will know that your audit settings are correct when all tiles on this dashboard are “OK”. Please keep in mind that it may take an hour before new audit settings are pushed by GPO to your end points and subsequently picked up by EventSentry. Detailed information about this dashboard is available here.
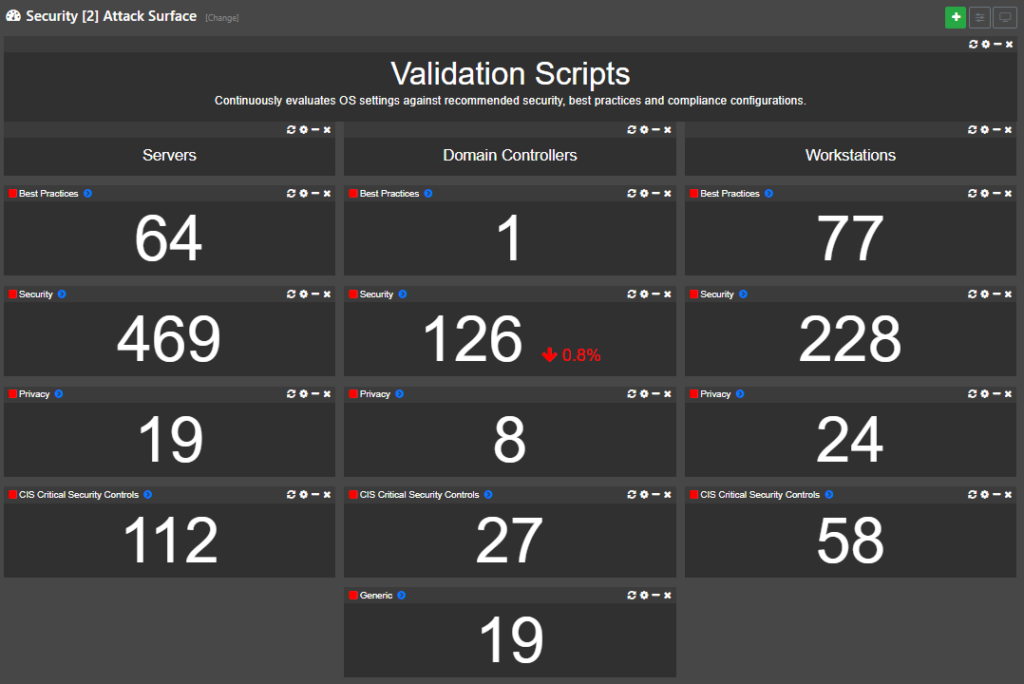
Once your audit settings are in the clear you can graduate to dashboard #2 – Attack Surface. This dashboard utilizes various validation scripts to ensure that your monitored hosts follow best practices and/or pass security and compliance requirements. The checks are generally divided into different categories like
- Best Practices
- Security
- Privacy
- CIS Critical Security Controls
Most findings on this dashboard can usually be resolved via group policy and/or registry settings. The end result is a reduced attack surface of your network since your monitored hosts will now adhere to recommended best practices and security recommendations. More information about this dashboard can be found here.

The last dashboard, “Security [3] Critical Changes” illustrates critical changes that have occurred on your network (and domain) recently. This dashboard should be reviewed daily and will reveal important changes like
- Services/Drives/Scheduled Tasks added
- Software Installed
- Recent logon failures
- Important AD changes
Patch 104 also includes improvements to the names of built-in event log packages, which have been consolidated and given better, more descriptive names. As such, expect a lot of changes if you do a package update in the management console.
Another useful improvement is that you can now easily access information about security events with a new “info” button in the management console.
If you’re running EventSentry 5.1 then download the latest patch and make sure to install & review the new security dashboards!